
The traditional two-dimensional method of plotting portfolio risk and return, easy to illustrate and comprehend, remains a starting point for building most investment portfolios. For insurers, however, this method may not be sufficient.
An investment portfolio should be designed to serve an insurer's unique needs: asset-liability management, liquidity needs, regulatory constraints among others. Adding these factors to a risk-return analysis would likely add complexity, but expanding beyond the two-dimensional risk-return graphic may provide valuable insight to help insurers develop a more appropriate and efficient custom strategy.
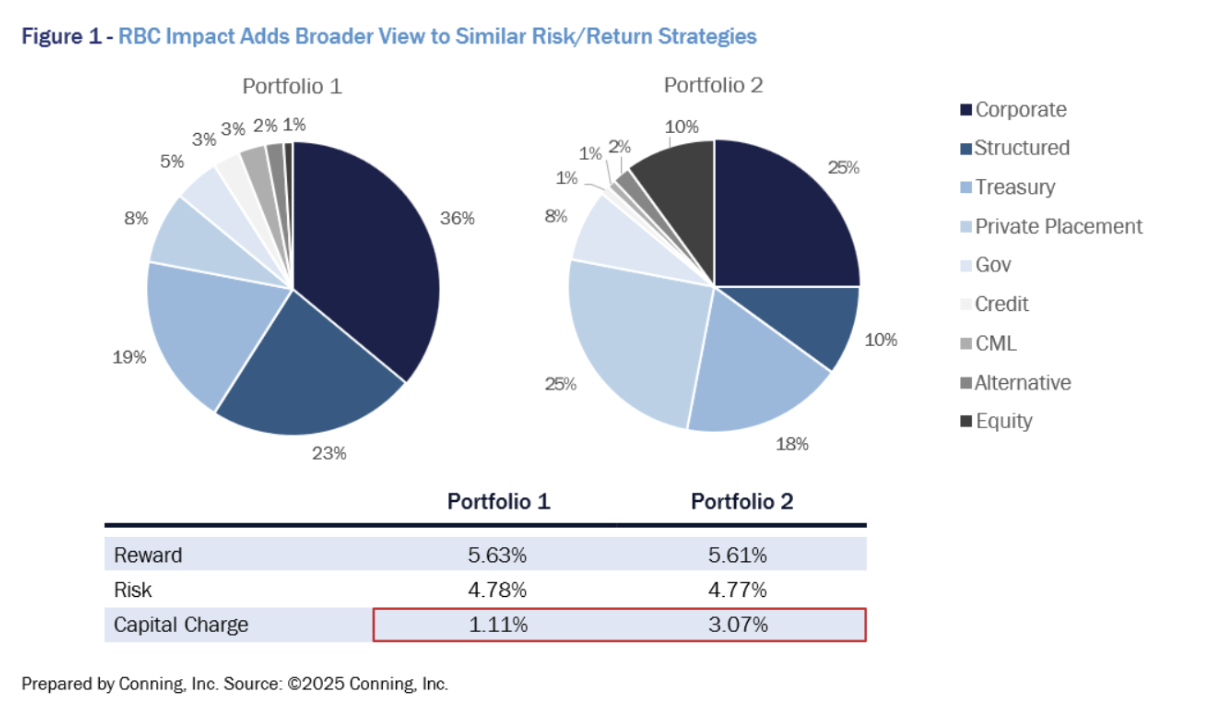
As an example, consider risk-based capital (RBC) charges. A variety of investment strategies may offer similar or even equal risk-reward profiles, but they can vary significantly in RBC charges (see Figure 1). Though they share similar risk-return profiles, Portfolio 1's higher allocation to highly-rated structured securities results in a lower overall capital charge, while Portfolio 2's higher charge is primarily due to its greater equity allocation. Higher RBC charges can lead to higher hurdle rates and inefficient use of capital. A strategy with a lower RBC charge would enable insurers to free capital that can be used either for business expansion or returning to shareholders or policyholders. The added perspective on RBC charges can be a significant benefit.
Insurers face a growing array of challenges in all aspects of their business, and their investment portfolios are not immune. As interest rates in the past few years climbed back from an extended period of historic lows, insurers have an even broader menu of options worth considering in developing portfolio strategies. Given the other factors that can affect an insurer's investment choices – each firm's distinct book of business, risk tolerance, preferences, etc. – the more extensive the review of potential outcomes, the better an insurer's decision-making is served.
Modeling for Insurers: A Higher Standard
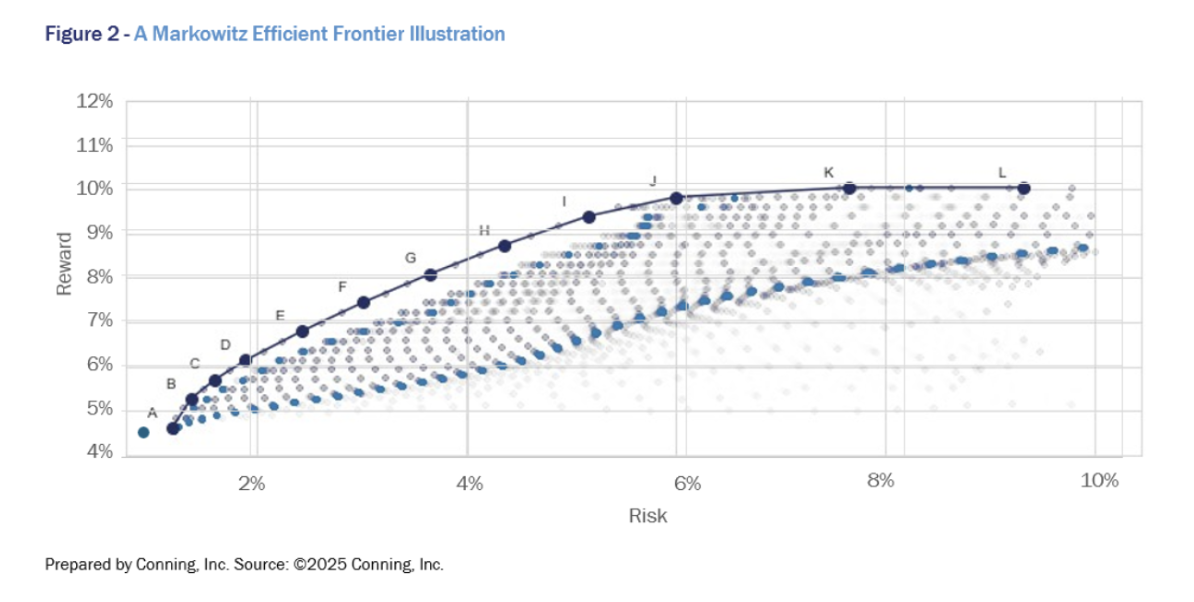
Investors typically view portfolio optimization through a framework known as the Markowitz Efficient Frontier. It helps balance risk and reward, often represented by standard deviation and the average of historical returns, respectively, although there are a variety of metrics to measure both. Insurers, however, require a broader set of considerations.
Markowitz's mean-variance optimization assumes that asset returns follow a normal distribution, but that is often not the case. This can lead to inaccurate risk assessments, especially during extreme market conditions.
A more sophisticated level of modeling risk and return includes the use of a stochastic economic scenario generator to project multiple scenarios for asset returns, volatilities, and correlations based on historical data and probabilistic models, capturing the non-normal behavior of asset returns. In this approach, risk and reward are defined as the average and standard deviation of portfolio returns across scenarios at a long-term steady state.
Figure 2 shows optimization results when applying the Markowitz framework. Each dot represents a portfolio with unique asset compositions, leading to different risks and rewards. However, this classic focus on two variables (risk and reward) does not capture all the specific nuances that insurers must consider when making asset allocation decisions.
If we add in the risk-based capital aspect – one of many other metrics that might be important to portfolio construction, but hardly the only one – we immediately add greater complexity. While the relationship between risk (expected volatility) and capital charge has a positive correlation, it is not linear.
To build upon Figure 2 and adding a third component – the aforementioned RBC metric – we would need to plot a three-dimensional graph which covers risk, reward and capital charge (see Figures 3 and 4).
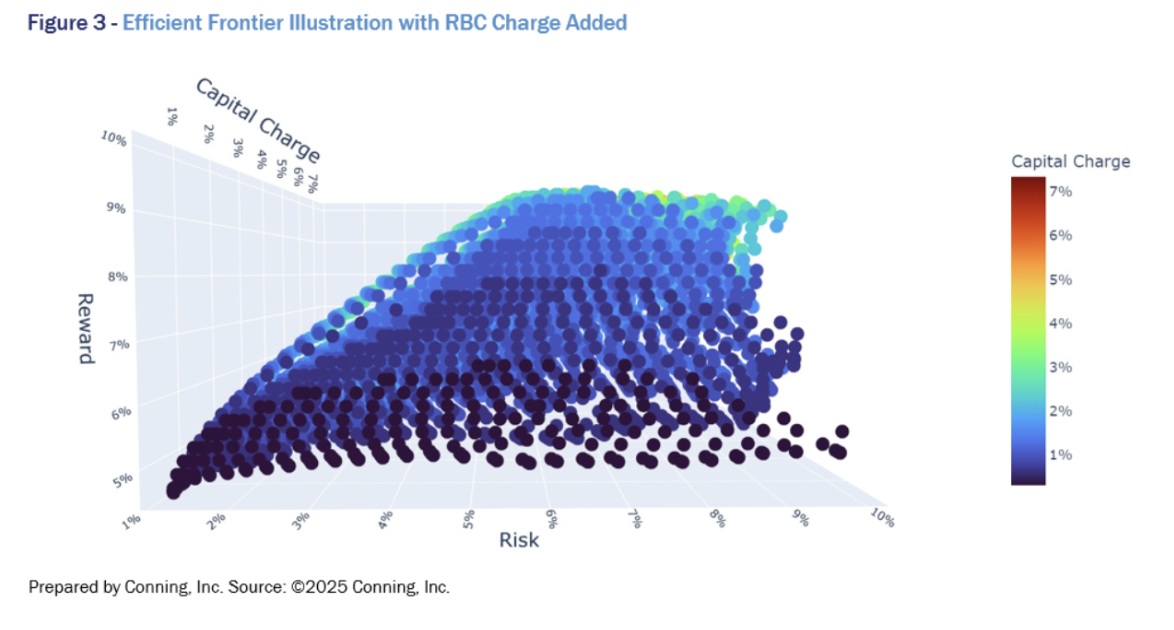
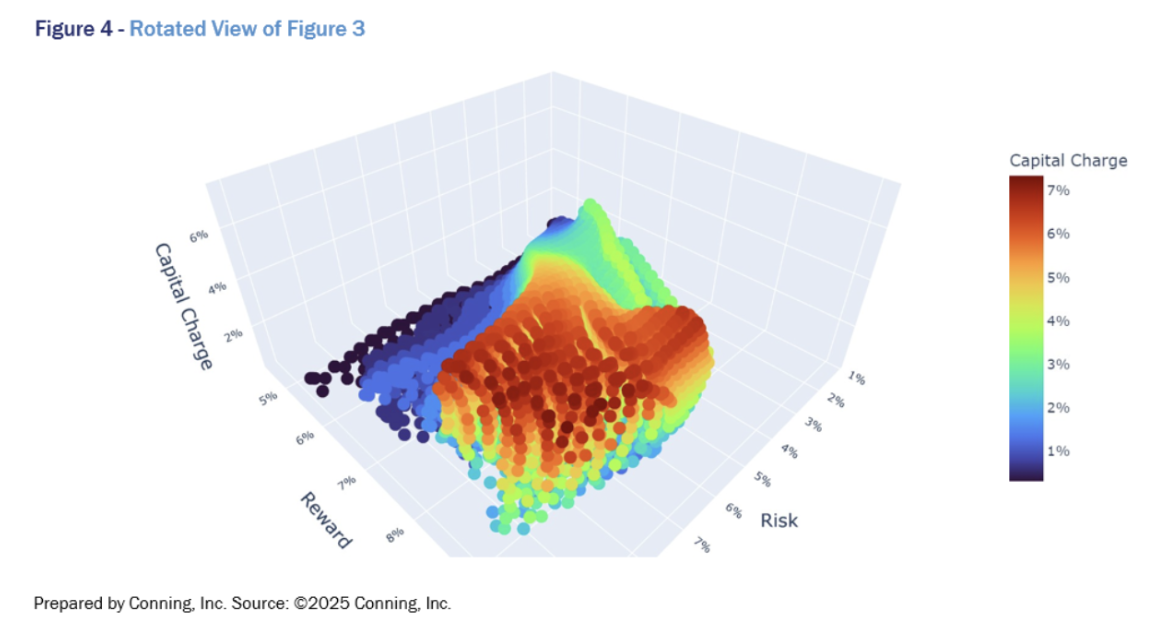
Figures 3 and 4 show the same underlying data as Figure 2 – each point represents a portfolio - except these illustrations includes a third aspect: RBC charges. Rather than a smooth surface, we observe hills and valleys indicating nonlinear relationships among risk, reward and RBC charge, precisely the type of information that is lost in using the traditional Markowitz framework. What concerns us is no longer an efficient frontier line, but rather an efficient surface.
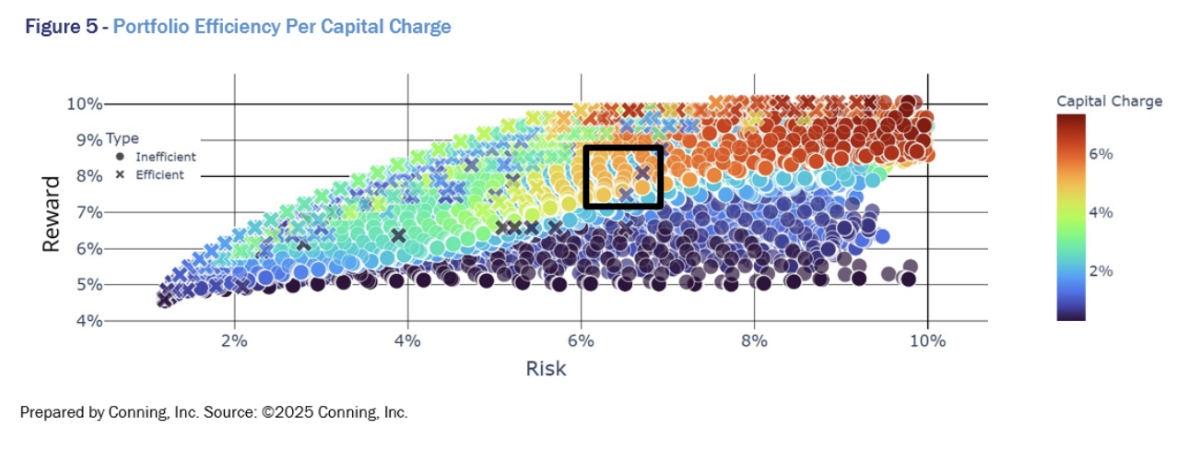
One way to generate capital-efficient portfolios is to solve for efficient surface portfolios, in our example that being the efficient frontier portfolios for the desired capital charge. This is shown in figure 5, where efficient portfolios for a given capital charge are marked by 'x'. The figure also highlights the inadequacy of considering only risk and reward where two very similar portfolios can be vastly different in terms of capital efficiency as shown in the back rectangle above at Figure 5.
Tailored Solutions for Unique Challenges
Of course, not all insurers are alike. Two different insurance companies holding identical asset portfolios will have different RBC ratios because of differences in other components of the RBC formula, namely insurance risks, interest rate risk and business risk. And of course, RBC is just one consideration among many. As such, we cannot have a one-size-fits-all portfolio for insurers.
Our narrative thus far has ignored the liability side of the puzzle. In practice, insurers need to consider the interplay between the assets and liabilities; indeed, a portfolio that appears appropriate from an asset-only perspective can be completely inappropriate from an enterprise perspective. A Strategic Asset Allocation (SAA) exercise then should consider cash flows generated by both assets and liabilities under different economic scenarios, in addition to the considerations discussed previously. This requires sophisticated dynamic financial modeling systems that can incorporate assets and liabilities as well as regulatory capital requirement. Last but not least, the model should be able to capture the impact of selling assets from an existing portfolio and buying into a new one.
To summarize, insurers are different from the "average" investor type because of the myriad of considerations insurance asset management demands, which can be better served by sophisticated insurance-focused modeling capabilities. Given the demands of the competitive environment, insurers may wish to work with an asset manager with deep knowledge of the insurance and investment environments, as well as the experience and tools to help them develop more sophisticated approaches to asset allocation, to assess the risks and rewards of optimizing their investment strategies.