
Download

Inflation and Insurance Replacement Costs

Key insights into the relationship between inflation and insurance replacement costs as basis for P&C / Non-Life capital allocation line performance, and solvency

Tire Pump

Synopsis/Summary: This executive briefing looks at the relationship between overall inflation and insurance replacement costs in six of the world’s largest insurance markets: the U.S., Canada, the U.K., the E.U., Japan and Korea.

Specifically, the briefing’s analysis focuses on P&C/non-life replacement costs for commercial and personal property and personal and commercial vehicles including construction materials, auto and auto parts and labor. The results provide correlation estimates across and within each country, organized first around property and then vehicles, identifying statistically significant and non-significant coefficients that confirm and question received expectations.

The briefing’s analysis builds on the authors’ research at the Insurance Information Institute on overall inflation and P&C replacement costs in the U.S. Applications include business strategy, planning, and maximizing underwriting performance and solvency during times of economic stress such as the current high inflation environment.

* * *

Key insights into the relationship between inflation and insurance replacement costs as basis for P&C / Non-Life capital allocation line performance, and solvency

This executive briefing looks at the relationship between inflation and P&C/Non-Life insurance lines in the United States, Canada, the United Kingdom, the European Union, Japan and Korea. It aims to provide the reader preliminary insight into the quantitative relationship between overall inflation and insurance replacement costs within and across the covered countries. We define insurance replacement costs, as opposed to a country’s overall inflation, as the average increase in prices for specific goods and services paid by a P&C/Non-Life towards repair and rebuild costs for total losses paid.

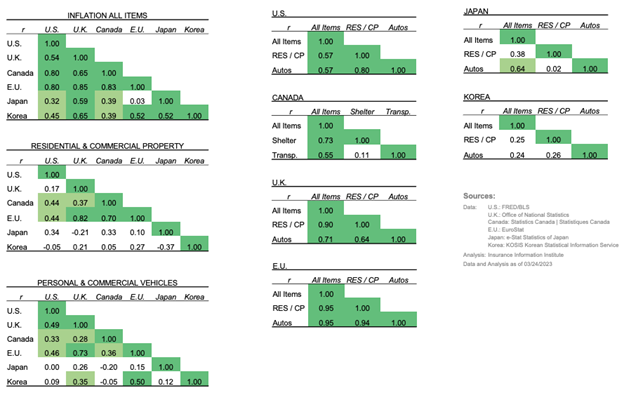
Correlation patterns for changes in residential and commercial property replacement costs identified three distinct groups: the U.S., Canada and the E.U. were correlated to one another with different degrees of significance, while Japan and Korea showed no significant correlation to one another or any of the other countries. Personal and commercial auto correlation patterns also identified three distinct groups overlapping with those of property, though Korea showed some significant correlation with the U.K. and the E.U.

Quantifying the relationship between inflation and insurance replacement costs across national and regional P&C/Non-Life insurance markets can provide an additional framework to maximize insurance capital allocation, including reinsurance capacity, by seeking uncorrelated underlying economic fundamentals and insurance performance metrics. Further, separating correlated and uncorrelated line-specific insurance replacement costs drivers can increase the ability to forecast line-specific performance metrics and provide added guidance to industry stakeholders, including regulators, seeking to maximize liquidity and solvency during times of economic stress such as the high inflation that characterized the COVID-19 pandemic and its aftermath.

In a very preliminary manner, the correlation analysis reported in this briefing indicate that it may be possible to minimize the impact of historically high increases in P&C/Non-Life replacement costs by diversifying exposure to property and auto lines by selecting different insurance markets based on the extent of correlation between overall inflation and replacement costs across and within countries. For example, pending further research and validation, grouping the six countries we reviewed into three cohorts may reduce the drag of historically high replacement costs on individual lines’ performance metrics; these cohorts being the U.S., Canada, the U.K. and the E.U.; a stand-alone Korea; and a stand-alone Japan. 

In the U.S., the difference between increases in overall CPI versus changes in insurance replacement costs has proven to be significant. Between 2019 and 2022, increases in P&C replacement costs averaged twice that of the overall CPI. Given this spread, insurance replacement costs baskets are becoming a more precise and timely input into forward looking loss estimates and the impact of inflation on line-specific performance metrics.  

This briefing is divided into four sections. First, it introduces the distinction between overall inflation and insurance replacement cost and its relevance to our understanding of how macroeconomic fundamentals drive insurance performance. 

It then seeks to identify and quantify correlations between overall inflation and replacement costs within and across the sample countries, for property and then autos. The analysis of property and auto replacement costs, the core of this briefing, provide descriptive year-over-year and year-over-five-year inflation estimates, and correlation analysis of the relationship between price changes for each line within and across the covered countries. The last section describes the methodology including additional inflation and correlation graphs and tables.

This briefing’s scope is limited: it explores correlations between overall inflation and replacement costs for property and auto only; restricts itself to descriptive statistics rather than inference; and pairs inflation components from different national inflation metrics indices even though those may not fully overlap in their individual definitions. The methodology section expands on these insight and limitations.

This briefing’s analytical framework draws from Triple-I’s research into the relationship between overall inflation and insurance replacement cost in the United States over the last three years.  That methodology deconstructs the U.S. CPI Urban-all items into separate goods and services baskets aiming to be most representative of specific insurance lines’ “repair and rebuild” costs.

Residential and Commercial Property
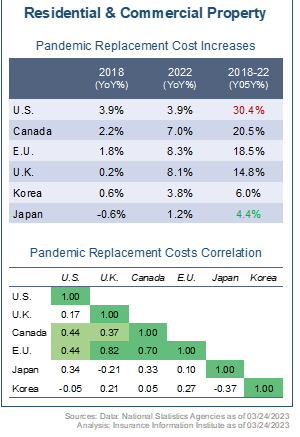
ChartThe U.S. experienced the highest five-year cumulative inflation between 2018 and 2022 of the cohort. Over that period, overall U.S. inflation on a cumulative basis reached 20.7%. The U.S. was closely followed by the E.U. at 20.31%, the U.K. at 17.7%, Canada at 17.0%, Korea at 11.9%, and Japan at 3.3%. This stands against a backdrop of correlated overall inflation across the six countries. This is against a backdrop of overall inflation correlated to various significant degrees across the U.S., Canada, the U.K., and Korea, but not across those countries and Japan and the E.U.

Cumulative increases in property replacement costs were higher than overall inflation in the U.S., Canada and Japan. Conversely, overall inflation was higher than increases in property replacement costs in the U.K., the E.U. and Korea.

Over the same period and across the six countries, the U.S.  experienced the highest cumulative increases in property replacement costs at 30.4%, followed by Canada, the E.U., the U.K., Korea and Japan. Property replacement costs correlations grouped the six countries into three cohorts: the U.S., Canada, the U.K. and the E.U.; a stand-alone Japan; and a stand-alone Korea. The four countries in the first cohort show different degrees of correlation significance with one another while the second and third cohorts show no correlation with either of the other cohorts or any of the other countries. Within the first cohort, Canada is strongly correlated to the E.U. Property replacement costs in Canada are strongly correlated to the E.U.’s but weakly to U.S.’ and the U.K.’s.  

Summary rational for the above relationships include the relative weight of property cost drivers within each country’s inflation baskets, construction material sourcing, free-trade blocs and domestic credit intermediation to name a few. We suggest further review.
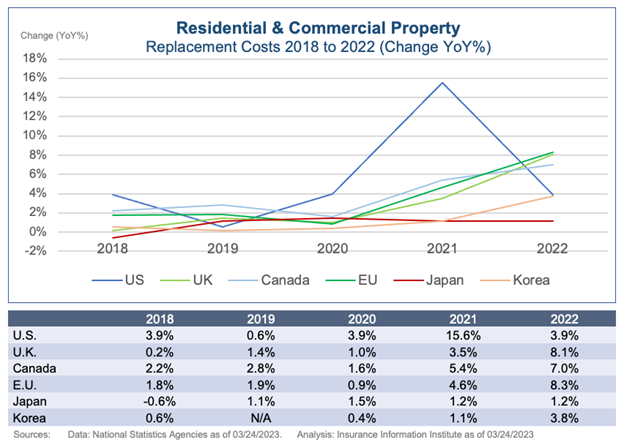
Chart 2
Personal and Commercial Auto

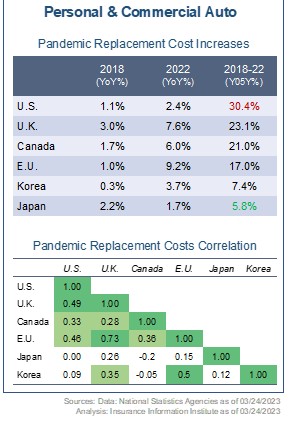
Chart 3Looking at the relationship between auto replacement costs and inflation within each of the six countries from 2018 to 2022, replacement costs correlate with overall inflation in the U.S., Canada, the U.K., and the E.U.. However, they do not correlate with overall inflation in Japan and Korea. Cumulative increases in auto replacement costs were higher than overall inflation in the U.S., the U.K., Canada, and Japan. Conversely, overall inflation was higher in the E.U., while Korea saw auto replacement costs increase less than overall inflation.

Over the same period and across the six countries, the U.S.  experienced the highest cumulative increase in auto replacement costs at 30.4%, followed by the U.K., Canada, the E.U., Korea and Japan. Auto replacement costs correlations grouped the six countries into three cohorts: a first cohort with different degrees of significant correlation between the U.S., the U.K., the E.U., and Canada; a second cohort between Korea, the U.K., and the E.U.; and third cohort made of a stand-alone Japan.  Within the first cohort, the strongest correlations are between the E.U. and the U.K., then those two countries and the U.S., and only last yet still significant the relationship between those three countries and Canada.


Even though it is beyond this briefing’s scope to move from descriptive statistics to inference, it is worth noting that supply chain integration seems to have less impact on replacement costs than might have been otherwise expected. The weaker yet significant correlation between replacement costs in the U.S. and Canada, which arguably share a single supply chain, compared to the stronger correlation between replacement costs in the lesser chain-integrated U.S., U.K., and E.U., point to the other determining intermediary variables. We suggest further review.
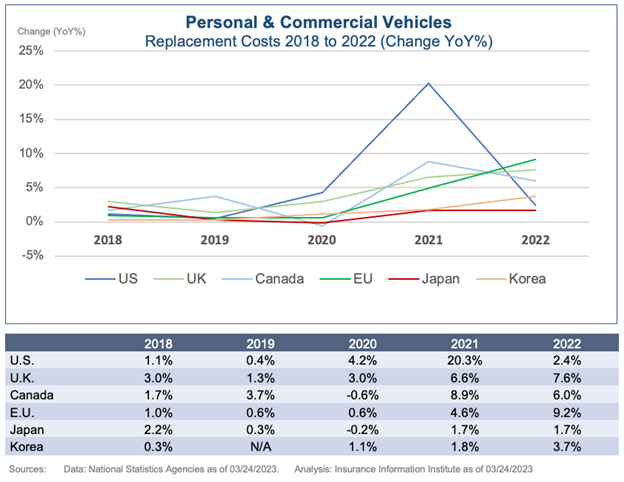
Chart 4
Methodology and Technical Notes

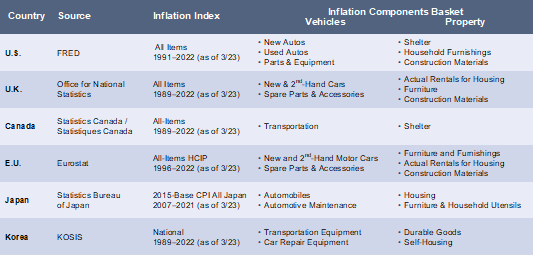
Aligned with the Triple-I’s mission to provide actionable data-driven insight to the P&C industry, our replacement costs framework uses publicly available government data for the major level-1 CPI or PPI components, those just below the index itself. In its current form, the selection of basket components is based on claims patterns and major categories for repair and rebuild by line.  The recomposed line-specific baskets are weighted to qualitatively match loss patterns. We are currently using machine learning trees to optimize both the selection and the weighting of each line-specific basket. We expect to publish preliminary results of this analysis this summer.
Chart

We chose to gather data directly from national statistical reporting agencies rather than rely on international agencies or multi-laterals. This decision was based on data availability and timeliness, consistency and familiarity for economists following each country, and better control over inflation basket component selection and taxonomy. We acquired roughly thirty years of data from national statistical agencies where possible or, otherwise, as much as was available. Because there is little international uniformity in inflation reporting, we had to find approximates and equivalent data to the lines we use in constructing replacement costs estimates for individual U.S. P&C lines.

Given the constraints under which we were working, we were unable to access inflation data for specific consumer items in Canada, and instead used the generalized categories of Shelter and Transportation, which include often-volatile fuel price data. Japanese data was only available starting in 2007 and, due to reporting lags, lacked 2022—this was the most limited country in the analysis cohort. In addition, we had trouble accessing data relating to construction materials. It is worth noting that much of the data for E.U. was available, but referred to by different labels (i.e., Second-Hand Cars instead of Used Autos, or Actual Rentals for Housing instead of Shelter). This data was otherwise equivalent.

Once monthly index data was acquired, the rate of inflation for each year was calculated as the percent change from December of the previous year to December of the year in question for each data series. This is in keeping with the generally accepted practices of reporting annualized inflation. In addition to translating the raw data into the more familiar inflation rates, this also deserialized the data and made erroneous correlation less likely. To calculate inflation over several years, we calculated the product of the inflation rates of the intermittent years.

Homeowners and Auto replacement costs were calculated as the unweighted averages of housing-related inflation rates and auto-related inflation rates, respectively. With the lines of business aggregates calculated, we generated correlation matrices across-country for each line-of-business plus overall inflation, and within-country matrices across data series. Since correlation coefficients require paired data, each pairing of country was limited to the lesser of the pair. For example, since Japan had the fewest observations, its pairings were limited to 14 observations.

We also calculated the p-values of each correlation based on the t-distribution to evaluate the robustness of each correlation coefficient. (The p-value represents the probability of making a false-positive error in examining statistical measurements, thus the lower the p-value the more robust the measurement is). We labeled correlations with p-values between 0.10 and 0.01 as weak (colored light green), and correlations with p-values less than 0.01 as strong (dark green). This is consistent with regular practices in academia.

The matrices of correlation coefficients were color-coded based on coefficient robustness, providing a road map for examining the relationships between countries, input sources, and how trends in one country can cascade through supply-chains. There are some obvious limitations to relying on correlations; however, this provides a manageable survey of connections and trends, and represented the first step one would take in developing more causal links.
Graph

* * *

By Michel Leonard, PhD, CBE, Chief Economist & Data Scientist, and Riley Conlon, Research Analyst,
The Insurance Information Institute


The Insurance Information Institute reserves the right to change, improve or correct the information, materials and descriptions in this report. The information contained herein is the work of Triple-I analysts and contains information from third party sources. Triple-I gives no guarantees, undertakings, or warranties concerning the accuracy, completeness, validity, or timeliness of the information provided. Independent confirmation of the accuracy of the information contained herein is recommended. Any dated information is published as of its date only.


5.2023

About the Authors:

Michel Léonard


   Michel Léonard

   Chief Economist & Data Scientist

   The Insurance Information Institute


Dr. Michel Léonard, CBE, is the Insurance Information Institute’s Chief Economist and Data Scientist.  He brings more than twenty years of insurance experience including senior and leadership positions. In these roles, he worked closely with underwriters, brokers and risk managers to model risk exposures for property-casualty and specialty lines such as credit, political risk, business interruption and cyber. Dr. Leonard is also Adjunct Faculty in New York University’s Department of Economics. He is a member of the Insurance Research Council Advisory Board.


riley Conlon


   Riley Conlon

   Research Analyst

   The Insurance Information Institute


Riley Conlon joined Triple-I’s Economics and Analytics Department as a Research Analyst. He is responsible for providing analysis and insight on insurance and economic conditions, and developing forward-looking statistical models. He also consults the greater Triple-I team on becoming a more data driven institution. Previous experience includes research roles with Mission Measurements, New York University Department of Economics, and Sonoma State University Department of Economics. Riley holds a Bachelor of Arts in Economics, a Bachelor of Science in Statistics and a Bachelor of Arts in Pure Mathematics from Sonoma State University, and a Master of Arts in Economics from New York University, focusing on Quantitative Economics.



ITL Partner: International Insurance Society

Profile picture for user IISpartnerpage

ITL Partner: International Insurance Society

IIS serves as the inclusive voice of the industry, providing a platform for both private and public stakeholders to promote resilience, drive innovation, and stimulate the development of markets. The IIS membership is diverse and inclusive, with members hailing from mature and emerging markets representing all sectors of the re/insurance industry, academics, regulators and policymakers. As a non-advocative organization, the IIS serves as a neutral platform for active collaboration and examination of issues that shape the future of the global insurance industry. Its signature annual event, the Global Insurance Forum, is considered the premier industry conference and is attended by 500+ insurance leaders from around the globe.

Additional Resources

Creating an Exceptional Employee Experience

by Corey Pinkham, Chief Executive Officer, The Jacobson Group

Creating an Exceptional Employee Experience

The insurance industry’s evolving workplace requires organizations to rethink employee experience to better support today’s workforce. Prioritizing employee experience can strengthen engagement, retention, productivity, and long-term business outcomes.

Read More


Building Sovereign Disaster Resilience

Building Sovereign Disaster Resilience

In Swiss Re's latest Risk REconsidered podcast, Public Sector Solutions’ Gerry Lemcke and Marina Oberholzer explore innovative risk-transfer solutions that can strengthen countries’ financial resilience to natural disasters

Read More


Early-Onset Cancer Is Reshaping Risk: A look into the research; What the progress, plateaus, and pressures mean for insurers

Early-Onset Cancer Is Reshaping Risk: A look into the research. What the progress, plateaus, and pressures mean for insurers?

Cancer trends are changing, creating new considerations for insurers. New research from RGA reveals that while overall U.S. cancer mortality has declined, progress is slowing among younger populations as early-onset cancers, including colorectal and breast cancers, continue to rise.

Learn More


RGA Leaders of Tomorrow: Strengthening Public-Private Partnerships to Enhance Resilience Against Rising Losses from NatCat Events

by Dr. Robin Huettemann, Junior Engagement Manager, McKinsey & Company

Strengthening public-private partnerships to enhance resilience against rising losses from NatCat events

NatCat losses are challenging insurance affordability and availability, making public-private partnerships (PPPs) essential to strengthen coverage, prevention, and risk mitigation. Clear governance, better risk data and planning, innovative risk transfer, and stronger claims management can help insurers and governments build long-term

Learn More


Mitigating Chronic Pain in Workers’ Comp

Five key practices for a patient-centered approach are most effective in mitigating potential chronic pain issues in workers’ compensation.

A doctor in green scrubs touching a patient's back while she shows him where the spot hurts

KEY TAKEAWAYS:

--The first four key practices are: determining compensability quickly; communicating the claims process and status to the injured worker; providing quality, evidence-based medical care; and identifying delayed recovery factors.

--Perhaps the most important practice is working with the doctor and employer to encourage stay-at-work (SAW) and return-to-work (RTW), even when that requires modified duties.

----------

Injured workers often feel lost in the complex workers’ compensation benefit delivery systems. Difficult to understand, these systems leave injured workers confused, disbelieved and disrespected, which feeds a sense of hopelessness and abandonment. This can potentially contribute to the development or instigation of chronic pain perceptions and a poor outcome.

There are five key practices for a patient-centered approach that, when quickly addressed, are most effective in mitigating potential chronic pain issues in workers’ compensation. The first four are: determining compensability; communicating the claims process and status to the injured worker; providing quality, evidence-based medical care; and identifying delayed recovery factors. Perhaps the most important practice is working with the doctor and employer to encourage stay-at-work (SAW) and return-to-work (RTW), even when that requires modified duties.

Prompt communication among the healthcare provider, patient, employer and any other stakeholder to expedite treatments for the employee to return to full functionality and work will lead to the best outcome. For many workers, it is work itself that acts as a preventative measure as it supports an employee’s perception of being valued.

Factors That Contribute to Creating a Chronic Pain Patient

To support health, employers can provide a work environment that protects and promotes workers’ physical and psychological health and safety. Doing so requires attention to how cases of injured workers are handled. Let’s take a look at several workers’ compensation factors that contribute to creating a chronic pain patient:

  • Employers who do not respect injured workers’ complaints and injuries and treat all injuries as fraudulent claims.
  • Employers who do not immediately report all injuries, thereby delaying prompt compensability determination and benefits.
  • Employers who create barriers that delay return to work.
  • Employers (front-line supervisors or managers) who do not regularly communicate with injured employees while they are recuperating.
  • Delays in compensability determination by the claims administrator.
  • Delays in medical treatment authorization that lead to a lack of access to quality, evidence-based medical care due to a complex and unnecessary authorization process.
  • Failure to recognize underlying delayed recovery factors.
  • Inaccurate or delayed diagnosis by the medical provider.
  • Physicians who focus on pathology and not on the whole person.
  • Healthcare providers who do not provide the time for meaningful patient interaction and education.
  • Healthcare providers who do not follow evidence-based medicine treatment protocols.
  • Healthcare providers or injured workers who have hostility toward the employer/payer.
  • Attorneys who do not focus on assisting the injured worker in returning to health and work.
  • Lack of communication among stakeholders that delays care and leads to chronic pain and unemployability.

Delayed recovery and ever-worsening disability are often even more pronounced in individuals with poor coping skills and other behavioral, characterological, personality and psychological issues. Underlying personality structure and motivation are often determinants for disability. Chronic pain complaints may be linked with significant disability.

See also: State of Mental Health in the Workplace

What Can Be Done?

By facilitating better medical outcomes, we can get injured employees back to work faster and steer clear of the traps that can lead a patient into a downward spiral, both medically and psychologically. There are nine key factors that influence positive outcomes:

  1. Recognizing when there are delayed recovery factors that may increase the likelihood of chronic pain.
  2. Recognizing that pain medicine escalation without benefit is a risk factor for a poor outcome.
  3. Minimizing delays in compensability determinations and treatment authorizations, which may result in poor and costly outcomes.
  4. Making prompt referrals to appropriate medical professionals, including alternative therapies when possible, for an injured worker identified as a risk for chronic pain.
  5. Emphasizing appropriate communication with the injured worker.
  6. Setting appropriate expectations for recovery and return to work for modified or full duty.
  7. Overcoming fear of reinjury through communication and education.
  8. Supporting physical activity and alternative therapies for pain management.
  9. Encouraging the injured worker to seek support from family, friends, social and, if appropriate, religious communities.

Better, faster medical outcomes are a win-win for injured workers and their employers. Following these best practices can more effectively address the needs of injured workers and provide them with the attention they deserve, resulting in getting back to work faster and a positive experience overall.

As first published in WorkCompWire.


Annu Navani

Profile picture for user AnnuNavani

Annu Navani

Dr. Annu Navani is the chief medical officer for Boomerang Healthcare, with more than 20 years of experience in the medical industry.

Dr. Navani completed her anesthesiology residency at the Medical College of Wisconsin, Milwaukee and a fellowship in pain medicine from the University of California, Davis. Over the last decade and a half, she has served as founder and CEO of Comprehensive Spine and Sports Center.

Dr. Navani is an adjunct clinical associate professor at the division of pain at Stanford University. Dr. Navani sits on the editorial board of the journal Pain Physician and serves on the board of the American Society of Interventional Pain Physicians, the Ortho Biologic Institute Networks, California Society of Industrial Medicine and Surgery and California Society of Interventional Pain Physicians.

She has also written several national guidelines, including on opioids, interventional spine epidural procedures, facet joints and biologics in the lumbar spine. 

'Intelligent Ingestion': Time to Truly Go Digital

The industry kids itself about having gone paperless. In fact, we still use the same processes we used in the 17th century. It's time for a change.

Skyscrapers against a dark blue sky with a cyber circle in the background

KEY TAKEAWAYS:

--A typical process involves routing the submission to a lower-cost resource, often offshore, who might extract and convert 50 of the 500 important pieces of information in it into digital data.

--But tools that combine natural language processing with computer vision can now extract all the key data from both structured and unstructured documents with great accuracy and speed.

----------

For over a decade, we have pretended to be paperless. We tout the fact that the file cabinets, the seven-part specialized file folders and massive mail rooms have all been eliminated and reduced, and we claim we are paperless. But we know we aren't. Today’s paper is PDFs, Excels and Adobe.

The filing cabinets have been replaced with digital folders and the mail rooms with emails and digital workflows. But insurance isn’t paperless; it just pretends to be.

It doesn’t have to be that way. The technology to become truly digital exists. We just need to take the leap.

One of the biggest hurdles to being truly digital as opposed to being a digital paper industry involves the initial ingestion or digitization of the data. We have had advanced OCR and computer vision solutions for a while. These have been great at extracting the information from digital forms and standardized templates but have not met the needs of more complex undertakings such as commercial insurance submissions.

The typical commercial insurance new business submission or quote request can contain an application, loss runs, statement of values, insurance certificates, financial statements and many other documents, depending on the type of insurance. A typical commercial insurance submission will contain 300 to 500 pieces of information. Information that is invaluable in understanding, evaluating and quoting a piece of business.

The untapped potential of dark data

Our processes today to extract the data from these submissions are archaic. A typical process involves routing the submission to a lower-cost resource, often offshore, who will extract a minimum set of fields to set up the submission and some basic rating information. On a good day, they might extract and convert 50 of the 500 pieces of information into digital data by entering it into the system. The rest is left in the documents as dark data. Data that the carriers have, but that is never digitally exposed or available.

Then the electronic file, carrying the electronic documents, is sent along to the underwriter, where these digital documents are opened again and again because the data isn’t available. Other than the file folder and the documents being made out of bits and bytes rather than paper and ink, it is the same process as 300 years ago.

It doesn’t have to be that way. We have seen what insurance can become with speed, efficiency and precision when the process is digital with simpler and homogeneous risks in personal lines, but the promise is there for more complex insurance such as group benefits, commercial lines and specialty insurance. And it starts by being able to digitally ingest the data.

This is where we have seen a technological leap. With the integration of more advanced machine learning tools that can combine natural language processing with computer vision, data can now be extracted from both structured and unstructured documents with high degrees of accuracy and speed. In fact, this is one of the hottest emerging technology areas in insurance today with a wide array of players and investors. Take the case of a life insurer in China that has deployed an intelligent risk control system that enables end-to-end automation of insurance applications. (See, Fuel the future of insurance)

See also: Seeing Through Digital Glasses

Learn from the emerging leaders

One of the other emerging leaders in this space is a company called MEA out of the U.K. What makes MEA unique is that it was founded by insurance executives who understand the unique challenges involved in complex insurance documents as well as having a key understanding of the terminology, variability and complexity involved. Their solution has focused on building deep expertise and a broad insurance-specific extraction catalog around core insurance concepts, starting with submission documents that allow their solution to be quickly adapted to new insurance areas. The best part is that, because their team deeply understands insurance, working with them does not require you to train their team on what insurance means.

We have worked with MEA on several engagements and tests throughout Europe and the U.S. The breadth of their solution has allowed us to evaluate a wide range of lines of business, business processes and insurance entities including carriers, MGAs and brokers. They can consistently compete in terms of speed, accuracy and quality in their testing and execution. It is really possible to be going from evaluation to use of this type of solution within a few short months.

So, what does this mean for our digital paper world today? Well, it means insurers now have a real choice to begin a digital journey. This has been the hope and dream for a while, but technology has really caught up to that vision of being digital – starting with intelligent ingestion.

Creating truly touchless processes

There are several different ways in which to now employ it. It starts by identifying a pseudo-paperless process that exists in your organization today and targeting the documents that it ingests. Submissions are an obvious choice, but claims, bordereaux, invoice receipts, audits, etc. are all also possible. Then design how you want the digital process to work. You can choose to ingest and directly process the data or take a more cautious approach that still includes some level of human review or human insight.

The choice should depend on the complexity and significance of the data and your comfort with implementing it, but long term you should expect that at least some portion of your ingestion will be able to be touchless. The other decision to make is whether you are only going to extract the data that you use today or do you want to extract everything in the document. This is the 50 versus 500 question for submissions. But you may require some other changes and other technology to aid a true digital transformation. We will discuss those elements in a future blog.

In the meantime, however, isn’t it time that your insurance process was no longer from the 17th century? Isn’t it time that we moved from passing along the digital paper in email and workflow systems to building truly digital processes? Isn’t it time to start to build your company’s intelligent ingestion solution? Let’s start to build real digital insurance.

You can find this article originally published here.


Michael Reilly

Profile picture for user MichaelReilly

Michael Reilly

Michael Reilly is a managing director in Accenture's insurance strategy practice.

He has 20 years experience helping insurance companies to transform underwriting operations and organizations around the world; he has led large-scale commercial insurance transformation programs in underwriting, policy, business intelligence and mergers and acquisitions.

Reilly has also co-written and presented multiple articles on underwriting, analytics and knowledge management and worked at General Accident Insurance prior to joining Accenture.

Commercial Insurance’s Digital Revolution

In commercial insurance, customers and providers can look forward to an improved experience as the market shifts toward online channels.

Blue tinted view of tall glass office buildings

KEY TAKEAWAYS:

--Currently, non-core activities absorb roughly 40% of underwriters' time. Traditional manual quote and pricing processes are too time-consuming, especially as consumers demand quotes in hours rather than days or week. 

--Luckily, scalable and authoritative data is accelerating the transition to automated models.

--91% of commercial insurance customers said they would get a quote online — but only 28% had. The gap means there is a significant opportunity for insurers willing to invest in streamlined, automated processes. 

----------

2023 is the year of hyper-digitalization in commercial insurance; providers have recognized the benefits of automation and are embracing it. As the industry evolves, insurers are bringing the advantages of cutting-edge technology and advanced data capabilities to agents and the businesses they represent.

An improved customer experience was cited as a top priority by the Council for Independent Agents and Brokers (CIAB) in its annual outlook report. This new, streamlined purchasing process benefits clients and policy providers alike by enhancing the agent and customer experience while improving efficiency. It also means valuable insights for underwriting and pricing. Insurance companies that have adopted this approach have a significant advantage over their competition, which translates to sustainable profits in a competitive marketplace.

Changing Legacy Processes Across the Value Chain 

Historically, commercial insurance was a highly manual, high-touch business. The detailed nature of the work could lead to significant price quote delays. Underwriters manually verified different aspects of risk — the type of business, number of employees, financial situation, etc. — because legacy data systems could not process complex business transactions and data sources were fragmented. 

This was especially true for small and micro-businesses, where insurance underwriting is highly volume-driven. The low margins associated with these types of businesses, and the high costs that come with them, make high-touch underwriting impractical. 

Commercial insurance is in high demand, with the U.S. receiving more than 400,000 new business applications every month since the start of the pandemic. Currently, non-core activities absorb roughly 40% of underwriters' time, which amounts to approximately $85 billion to $160 billion in efficiency losses over a five-year span. And consumer demand calls for quotes in hours rather than days or weeks. Traditional manual quote and pricing processes have become too time-consuming, particularly within these small and micro-business segments. 

Further, the legacy approach runs the risk of error and lost or incomplete data. Under the traditional process, insurers may find it challenging to develop an accurate picture of business risks or to make informed pricing and policy decisions.

Luckily, scalable and authoritative data is accelerating the transition to automated models. AI-based processes and alternative data sources, such as aerial imagery, offer new insights detailing a small business's historical information, assets and exposures. Automated processes ensure that all the information is complete and accurate while minimizing the amount of manual data entry needed. 

See also: Insurers Turn to Automation

Evolving Channels Improve Agent Insight

This technological shift has enabled insurance companies to offer a broader range of value. Commercial insurance agents have always brought vital advice and expertise to the industry. And as data sources become more accurate, agents can increasingly focus on the most complex transactions, offering specialized services and a more personal client experience.

Channel evolution is a crucial part of this improved customer experience. It introduces more online quoting and binding into the underwriting process. For example, in the latest TransUnion Annual Insurance Outlook Survey, 91% of commercial insurance customers said they would get a quote online — but only 28% had. These results indicate a gap in commercial insurance offerings and a significant opportunity for insurers willing to invest in streamlined, automated processes. 

The transition to purchasing policies online is a natural evolution for many business owners. They already purchase their personal insurance policies online and are willing to obtain commercial insurance the same way. As a result, most independent insurance agents anticipate a significant increase in online commercial insurance buyers over the next three years.

Although online channels are evolving, digitalization does not diminish the agent's role. Instead, it evolves it. Insurers will continue to use agents to acquire larger and more complex policies. Most agents know this and are responding by deepening their industry knowledge through investments in education and technology to better serve their clients and remain competitive in the marketplace. According to CIAB's annual outlook report, agents are also offering additional payment methods, improving application and renewal processes, hiring specialized personnel to improve the client experience and prioritizing additional client services.

Increasing Automation Leads to Better Allocation 

Agents are just one resource providers can look to as proof of technology's benefit. Commercial insurance provider expense loads remain high, and automation helps insurers balance those costs while better allocating resources. With the influx of data providers using AI and other digital technologies, it has become increasingly mainstream for commercial insurers to automate portions of their underwriting and pricing processes. 

Only a few industry pioneers have delved into this space in recent years. Now it’s becoming a progressively more common practice. With digital imagery and AI-based information collection processes, there is now an overwhelming number of solution providers in this landscape. For example, for many small business classifications, such as artisan contractors, automation is relatively commonplace, with a large amount of publicly available data. In the past, underwriters would review these risks and make pricing adjustments. Digital technology can streamline these simple underwriting processes and quickly generate a quote based on real-time data.

See also: Where Small Commercial Insurers Are Investing

As the underwriter's role evolves due to technology, it becomes more focused on data analysis and identifying unique risks that don't fit into these data-rich categories. To optimize these efforts, commercial insurers are channeling their dollars where it makes more sense. Highly complex cases benefit from strong underwriters and agents deeply involved in the policy.

At the same time, tech tools are available to streamline less complicated cases where scalable data is more readily available. This approach allows insurers to bring down expense loads faster.

Digitalizing Is Commercial Insurance’s Path Forward

The commercial insurance industry continues its digital transformation and is not stopping anytime soon. Today's business insurance customers expect a convenient and seamless purchasing experience — one-third of consumers will walk away from a trusted brand after a single poor experience. Digitalization is crucial to client retention and acquisition.

Commercial insurers are turning to digital channels and using available data to meet these expectations and stay competitive in the marketplace. This move allows them to offer their customers more efficient, personalized service and stay ahead of the competition while improving their bottom lines. By embracing digital technologies, commercial insurers can enhance the consumer experience, improve their process and remain price-competitive for more homogeneous risks.

Specialty Markets Must Digitize

Specialty markets have fallen behind the pack on innovation, and many markets are threatened. But they don't have to be.

Man at a desk with a computer open and typing on a keyboard with a green mug of coffee in front of him

KEY TAKEAWAY: 

--With the introduction of digitization and a focus on innovation, processes can be streamlined by allowing customers to purchase policies online, file claims on their mobile devices and receive real-time updates on their claims. This level of convenience may not be new to other sectors of the insurance industry, but it certainly is for specialty markets like those for boaters and water sports.

---------- 

In insurance, “specialty” has been left vague over the years. To me, it simply means niche, misunderstood, non-traditional, volatile. These characteristics all naturally drive away risk-bearing entities. 

As a result, specialty markets have fallen behind the pack when it comes to innovation. The status quo has been rising premiums, abandoned markets and limited underwriting appetite. A lot of markets are threatened.

But they don't have to be.

Take boating and water sports, a threatened market where insurers have shown less appetite every year and premiums have shot up. With the introduction of digitization and a focus on innovation, processes can be streamlined by allowing customers to purchase policies online, file claims on their mobile devices and receive real-time updates on their claims.

This level of convenience may not be new to other sectors of the insurance industry, but it certainly is for specialty markets like those for boaters and water sports. 

Renters historically were uninsured, which left a huge gap in coverage if they were involved in an accident. Renters found themselves either paying a large sum out of pocket or bringing a lawsuit against the business they rented from. But digitization makes it easy to offer renters a low-limits insurance policy to cover their exposure.

The result is a much healthier rental ecosystem for all involved and offers a model that can open up more insurance markets for rental businesses as a byproduct. 

See also: How AI Can Solve Prior Authorization

The adoption of next-gen insurance tech in the “specialty market” mitigates risk immensely compared with the more archaic forms of operations that rental companies have been using for their entire lifespan. The new model rids them of uncertainty, volatility and misunderstandings.

The trick is to streamline the necessary processes through innovative yet user-friendly technology: doing things right but also efficiently. 

By using technology, insurance companies can improve the customer experience, better understand risk and tailor policies to specific areas or activities.

As boating and water sports and other activities continue to grow in popularity, insurance companies must adapt and provide policies that cater to the unique needs of their customers.

It’s time we bring some clarity to specialty markets and provide solutions that have served larger markets for years. Not only is there a grave need for insurance in these niche areas, but there is also a huge opportunity. The insurance industry’s mission must be to continue to bring these innovative solutions across specialty rental markets from land to sea.


Cam Serigne

Profile picture for user CamSerigne

Cam Serigne

Cam Serigne is CEO and founder at vQuip.

He began his career in the NFL ,where he had a brief stint with the New Orleans Saints and Carolina Panthers as a tight end. After the NFL, he joined Ridgemont Equity Partners, where he worked across the technology, business industrial services, energy and healthcare sectors, collaborating with management teams to solve some of their most difficult problems.

Serigne left to start vQuip, a technology company dedicated to solving compliance and operational risks that have plagued the boat rental industry.

Gamification Comes to Life (Insurance)

Finance games have been shown to greatly help with life insurance sales -- and digital, large-scale versions are becoming available.

A chess board with the king pieces in the middle

For years, there’s been talk about how gamification, particularly focusing on financial literacy, can provide a significant lift to the productivity of life insurance agents. 

Two of the best examples to date are the financial literacy board games Praxis and Cyclic, deployed in South-East Asia in recent years. Agents who got prospects to attend in-person board game events were often able to close sales there and then -- reputedly with up to a third of the attending prospects!

While very valuable for those life agents fortunate enough to participate in such events, the games' logistics meant it was extremely difficult for them to be played at a sufficient scale to allow more than a small number of agents to benefit. 

The solution was always going to be a digital finance game. But were any game developers going to focus on this area? 

We’re now seeing this coming into focus, and a small number of digital financial games are coming on stream – albeit of varying degrees of sophistication.

FinQuest by JA Worldwide is at the simple end of the spectrum – with each game lasting just seven minutes. It states a series of actions (such as earning a scholarship to reduce school costs or helping a friend to pack his stuff to avoid paying a moving company). Players are then asked whether the actions are consistent with earning them money.

At the other extreme is Cyclic Town, developed by Cyclic Digital. This simulates financial life from age 25 to retirement at age 60. Players experience events such as marriage, parenthood, career progression, job loss, accidents and health issues. The game incorporates variations in market prices of stocks, gold and property, etc; and changes in economic factors such as interest rates and the level of unemployment. To navigate through all this, the player needs to visit financial institutions (bank, life insurer, general insurer, securities platform and more). There, they can choose to use various personal financial products and services – ranging from term deposits to high-risk stocks, and from mortgages to investment-linked life assurance products; each product operating as in real life. The game also includes a competition feature, which allows an insurance agent or financial adviser to set up a competition for his/her prospects. He/she can choose to get them together in person and play concurrently on their devices or have them play remotely. 

There are a few others, such as Stock Market Game by SIMFA, which focus on a narrow part of personal finance.

We can expect more digital finance games to come, and the early movers to improve their offerings progressively.

Free from the logistical challenges of board games, digital finance games can readily be deployed for thousands of agents and hundreds of thousands of prospects.


Nigel Hazell

Profile picture for user NigelHazell

Nigel Hazell

Nigel Hazell spent the early part of his career in his native U.K., working in the life and funds sectors, assuming the position of CEO for a unit trust company at the age of 26.

Aged 30, he moved to Asia, initially to Taiwan, where he helped establish the first foreign JV life insurer there.

Over the next decade or so, Hazell served as Asia head of life and health for a U.K. insurance group, CFO and board member of a listed life insurer and North Asia CFO/COO for an Australian banking group. 

At the age of 41, he went his own way; since then, he has established businesses in the education, hospitality tech, fintech and digital games spaces. 

Today, his primary focus is running Cyclic Digital, which develops mobile games for good. 

Hazell serves as the non-executive chairman of one of the largest MPF trustees in Hong Kong and as an independent director of a life insurer in Malaysia.

A Dire New Warning on Climate

A report projects that within five years the world will surpass the temperature threshold that we hoped to stay within for the next 25 years.

Image
Field

Efforts to slow climate change have for years focused on keeping global temperatures from rising more than 1.5°C above pre-industrial levels by 2050. But the World Meteorological Organization reported last week that there is a 66% chance we will exceed that 1.5°C limit in the next five years -- a quarter of a century before the date specified in the Paris Accords that went into effect just seven years ago.

The report shows that climate change isn't just a future problem. It's a now problem, posing major risks for insurers -- but also creating opportunities to better serve clients wrestling with a massive disruption. 

The WMO report doesn't predict that global temperatures will permanently exceed that 1.5°C mark just yet. It says the gradual increase in temperatures caused by greenhouse gases will be exacerbated by an El Niño event that is expected to warm waters in the Pacific Ocean starting this summer, following an unusually long La Niña that had cooled waters there but that ended in March. Temperatures should, thus, subside a bit whenever the El Niño ends and a La Niña begins again.

The report does say there is a 98% chance that at least one of the next five years will be the hottest on record and a 98% likelihood that the five-year period, as a whole, will be the hottest ever. The report adds that there is a 32% chance that the mean temperature for the next five years will surpass that 1.5°C threshold. 

We've already seen how climate change has increased the destructiveness of hurricanes in the Atlantic Ocean, such as last year's Hurricane Ian, which drew on especially warm waters in the Gulf of Mexico and intensified right before landfall. It caused more than $100 billion of losses ($60 billion insured) and was the third most destructive weather event on record. Warm waters in the Atlantic likewise fed a supercell that hit Fort Lauderdale last month. While a thunderstorm normally burns itself out after 20 minutes or so, the abundant energy from the water kept this one going for six to eight hours, dumping 25 inches of rain on the city.

An unusually active tornado season thus far this year in the U.S. also appears to be tied to the hotter temperatures, as are the wildfires that are bedeviling many Western states.

Just this week, Reuters reported that "farmers in Kansas, the biggest U.S. producer of wheat used to make bread, are abandoning their crops after a severe drought and damaging cold ravaged farms. They are intentionally spraying wheat fields with crop-killing chemicals and claiming insurance payouts more than normal, betting the grain is not worth harvesting." 

So, there are perils aplenty for insurers to watch out for.

But there are also plenty of opportunities to serve clients better through services that help them identify and reduce climate-related risks. ("A New Approach to Property Resilience," published last week, offers some thoughts on how to get started.

In addition, for insurers that develop expertise in underwriting clean energy projects, the number of new opportunities is massive. Based on the Biden administration climate bill passed last August, companies have already announced more than $150 billion of projects that take advantage of tax credits, and hundreds of billions of dollars of additional projects are expected. The climate bill (officially, the Inflation Reduction Act) also increased the lending power for the Department of Energy by a factor of 10. It now has $400 billion that it can allocate for clean energy projects. 

Many of those projects will fail, or at least won't live up to their grand promise. (I was at the Department of Energy, working on a project, when Solyndra began falling apart in 2010 after receiving a $535 million loan guarantee that became a huge political issue. The memories are still vivid.) But the track record of DOE loans and guarantees is quite good -- Solyndra, notwithstanding -- and suggests that many of the subsidized projects will become thriving businesses that will need insurance coverage for years to come. 

Here's hoping their efforts kick in in time to head off the worst effects of the truly scary trend that the WMO report identifies.

Cheers,

Paul

What Now for Inflation?

In our quarterly interview with Michel Leonard, the chief economist at the Insurance Information Institute, he explains what's driving inflation. 

Interview Banner

Listen Now:


ITL:

Hi, I'm Paul Carroll. I'm the editor-in-chief at Insurance Thought Leadership. I'm joined again today for one of the quarterly chats I look forward to very much with Michel Leonard, who is the chief economist and data scientist at the triple-I, the Insurance Information Institute, which is basically the scorekeeper as far as I'm concerned for everything that happens in the insurance world.

Michel, we've been talking for, I don't know, probably a year or so now about inflation and economic growth and the P&C industry and its growth prospects and so forth, and it seems the narrative has changed. I think that that's partly because you've been right more than the Fed has been right on inflation. You've been predicting a faster subsiding in the short term. And, actually, even since your latest quarterly report came out, the news has bolstered your point of view. Inflation was only 5% -- only 5% -- in the last 12 months, and producer prices actually came down. With that sort of background, I wonder if you could talk about how the narrative changed about inflation and growth and everything else.

Michel Leonard:

Absolutely. Well, it's great talking with you as always. It's funny how you just mentioned inflation is only 5%. Who would have thought we would say “only” a few years ago?

One area where we have looked is the drivers of inflation. There are two views in the economic world. One has been that inflation was driven by demand, given the government spending and so forth that changed purchasing patterns during COVID. In this view, for example, buying more goods for homes drove prices up. Another view was that inflation was supply-driven -- that disruption in supply chains and disruption in labor availability pushed prices up.

It's funny you mentioned that I was right about inflation more than the Fed. I'll take that.

But what we are saying is what the Fed itself was saying originally, that inflation was transitory and that it was driven by factors like COVID that cannot be impacted by monetary policy. Then, there was a shift in the Fed's narrative. They were seeing that inflation was supply-side-driven and that interest rates could not do much about that, and they were resisting increasing interest rates. Then pressure came about, and they had to do something.

As they had to do something, the narrative changed, as well. The tightening, which we're still going through, has seen, in parallel, a decrease in inflation. But that doesn’t mean the decrease is because the Fed raised rates. We don't see it that way. I don't see it that way.

And the new equilibrium is precarious because the underlying supply chain factors are still there, in terms of food availability and so forth. We could go back very rapidly to 6%, 7% or 8% inflation.

Where does that leave us on inflation? It leaves us in a place where inflation is coming down but is still a multiple of what it’s been historically – more than twice, as of today. And we’re still very vulnerable, because inflation isn’t about interest rates. We're still very vulnerable to a sudden uptick in supply chain problems with cars or construction materials or food, whose prices have largely had to do with the war in Ukraine. There’s geopolitical risk, with the situation in China and Taiwan, and so forth.

I think the Fed framed the issue very well originally.

ITL:

Do you think the Fed will slow these interest rate increases, or do you think they're still committed to them?

Leonard:

Fed officials probably never really let go of that original narrative of transitory inflation, that this was a supply chain issue. Now, what does this mean in terms of whether they will be more or less willing to loosen up monetary policy?

Frankly, it can go both ways. On one hand, you might want to keep demand down through monetary policy, knowing that there's uncertainty on the supply and that the supply can drop again. The other issue is growth. The tightening of rates has cost a significant amount of growth. Unemployment has remained low, but we have an election year coming up, and stock market returns have been flat, and interest rates on fixed-income instruments have peaked.

ITL:

As a result, you're being fairly cautious about growth, right? And the P&C line of business is very much tied to growth in home purchases, car purchases and that sort of thing. So, am I right that you have a pretty cautious outlook about P&C growth for the next year or two?

Leonard: 

Absolutely.

Last year, the economy was doing well, but there was a shift at the end of Q1 2022 in the economic narrative from pundits on Wall Street, in the financial press and in monetary policy circles. The shift was basically, overnight, to: We're going to go into recession. Capital spending, especially corporate expenditures, dropped. The Amazons of the world and so forth that had been investing in the new COVID economy of shipping pulled back. Everything stopped. I don't recall a moment in which some of the metrics reacted so strongly, and it wasn't because of the underlying data. It was because of this emerging consensus about a severe recession.

The narrative was especially damaging to the insurance industry, because traditionally we lag a bit behind the rest of the economy. We do better going into a recession, but it takes us a bit longer to get out of it. We were heading toward peak conditions for growth, with people buying cars again, people buying homes, furnishings and so forth. That all disappeared. That growth bump never materialized. And now we're going to be waiting again.

We were also disproportionately impacted by inflation because of what we rebuild and repair.

ITL:

It's certainly a confusing time. Some big player the other day recommended knocking down a bunch of office buildings that aren't going to be used, which would certainly change the equation in commercial real estate. You talked about the COVID economy. I saw a study the other day from one of the big consulting firms that did a major survey of travel managers and other people responsible for corporate travel and found that they expect that people are going to return to the office, but that work from home will go only from 3.9 days during the pandemic to 2.2 after it's all over. Before the pandemic, that figure had been 0.7 day a week, so we’re still talking about a massive change.

Leonard:

That's so true. We go through cycles.

We had a lot of growth in downtown areas. We had a lot of growth in the suburbs. Now it's about the exurbs. And that has such significant implications, not just in terms of where the growth is for P&C but also in terms of replacement costs. Labor availability in the exurbs is not the same as in the suburbs.

How do we get a sense of the underlying replacement cost framework when the data we get from government agencies and so forth is really on the basis of cities and states and regions? The issue today isn’t about one city versus another or one state versus another, it’s about different areas within the periphery of the city.

ITL:

Replacement costs have consistently been one of the bright spots in our conversations over the last six months or so. Prices are rising less rapidly than they did before, and in a few instances they're actually decreasing. Would you explain a bit what your latest thinking is on replacement costs?

Leonard:

They were disproportionately impacted on the way up because of the supply chain impact on prices of used and new cars, construction material, homes, lumber and so forth. On the way down, as we reach this, again, precarious wartime equilibrium, we're also disproportionately benefiting.

Now, this is a temporary place. It's very unlikely that we're going to stay there. Housing, cars and so forth are elements that could once again increase faster than overall inflation. Then you have to add exogenous factors such as extreme weather events. So, when we're thinking of rate setting for next year, speaking with regulators right now and so forth, we're in this position where, yes, the situation has indeed gotten better, but we have to be cautious.

Again, something goes wrong in Taiwan, something goes wrong with COVID or another disease or something happens with any number of other possibilities, and then, of course, Ukraine: All of the improvements could come to a halt, and we could be back at 6%, 7%, 8% inflation.

ITL: 

You mentioned these crazy weather events. I was so struck the other day by this thunderstorm that basically got going in Fort Lauderdale and never stopped. Ordinarily, a thunderstorm will burn itself out in 20 minutes or so, but there was so much warm water there in the Gulf of Mexico that they basically had a cloudburst for six hours and got 26 inches of rain. The whole place was inundated, and it seems like these wild weather events are happening more and more frequently.

Leonard:

In just the past three or four years, we've had cumulative increases in replacement costs, on average for some of our homeowners and commercial property lines, of 40%. We know these sorts of storms are getting more frequent and worse; imagine the same storm costing 40% more before too long.

ITL:

In Northern California, where I live, we've had an incredibly wet winter, which is great because we need the water and because wildfires have become a problem. But it seems like after having a very long La Nina weather phenomenon, we're about to switch to El Nino in maybe the next month or so, and that historically has meant very high temperatures across the U.S. There could be more tornadoes, there could be more wildfires and so forth as a result.

The last thing I wanted to be sure we covered is rates, which you started to mention. It seems like property/casualty insurance has been sort of chasing premiums for a while because costs have been high and they've been trying to catch up.

Leonard:

I think we're heading toward a fundamental shift. The notion of affordability and availability really will have to be to be rethought. Homeowners and corporations will have to look at insurance as a significant driver when making a purchase.

In places such as Florida, the P&C industry hasn't made money on the homeowners side in several years  even though rates have been going up significantly. People will continue to live in Florida. People will continue to live in some of those other places. So, the issue becomes really expectations about pricing and insurance.

ITL:

Final thoughts?

Leonard:

We’ve covered a lot. I’d just point to two red flags:

Inflation: Let’s not get complacent. It could very rapidly go back up, with just a few events in Europe,

Growth: The economy is resilient, but growth won’t be secure until two quarters after the Fed telegraphs a shift in monetary policy. All eyes are on the Fed, and, as the saying goes, don’t fight the Fed.

ITL:

That’s a great way to end. Thanks, Michel, as always.


Insurance Thought Leadership

Profile picture for user Insurance Thought Leadership

Insurance Thought Leadership

Insurance Thought Leadership (ITL) delivers engaging, informative articles from our global network of thought leaders and decision makers. Their insights are transforming the insurance and risk management marketplace through knowledge sharing, big ideas on a wide variety of topics, and lessons learned through real-life applications of innovative technology.

We also connect our network of authors and readers in ways that help them uncover opportunities and that lead to innovation and strategic advantage.

U.S. Is Ready for Parametric Flood Insurance

The insurance and wider markets have created the perfect conditions for parametric insurance to grow.

Water with ripples dark and showing a reflection

KEY TAKEAWAYS:

--A surge in property damage from natural catastrophes has made it nearly impossible to get adequate coverage at affordable prices, creating an opportunity for new approaches to risk transfer.

--Economic pressures have created a perfect storm: Businesses need to cut costs, including on insurance, but insurers must make sure their prices are realistic.

--Filling the gap in the market is a burst of investment of capital and expertise in parametric insurance, which will accelerate it from new entry to mass market in the years to come.

----------

Since launching FloodFlash in the U.S. earlier this year, I've been surprised to find that brokers and agents are familiar with parametric insurance. Many have even placed a parametric storm policy, based on hurricane or wind severity.

This is a stark contrast to our experience in the U.K. The majority of SME and mid-market agents there aren’t familiar with parametric insurance at all.

One thing they share with their colleagues in the U.S. is that flood parametrics is entirely new. When introducing FloodFlash, we most often hear one of two reactions. First, that it’s too good to be true. Second, why has nobody considered doing this before? 

The first reaction is simple to stave off with our A-rated insurance support, rapid payout claims and excellent service record in the U.K. The second is more difficult to answer. Parametric insurance has been around for 20-plus years in one form or another. By that token, it would make sense that parametric flood products would have come a long while ago. 

Right now, the insurance and wider markets have created the perfect conditions for parametric insurance to grow. Talking to our customers, agents, partners and investors, three trends emerged: a challenging insurance market; the cost-of-living crisis; and a surge in investment in parametric insurance.

A challenging insurance market

80% of the world’s flood damage goes uninsured every year. That’s $58 billion in unprotected losses. In the U.S., the picture is often even more stark. Aon estimates that last year was the fifth costliest on record from an environmental catastrophe perspective, and flooding dominated the uninsured losses. 

Those checking the receipts found out that only $1 billion of the $30 billion in flood losses in California were covered by insurance. When Hurricane Ian swept across the Gulf of Mexico, uninsured residential losses alone ranged between $10 billion and $17 billion. Guy Carpenter data suggests that up to 67% of hurricane losses in the U.S. were uninsured between 2012 and 2021.

The view for business isn’t much better – but it’s much blurrier. Most attempts to understand the impact of flooding focus on residential property, so insight on business flood risk is limited. When we carried out research with U.S. business leaders worried about flooding, 49% agreed they find it difficult to get affordable coverage for their property. The exodus of capacity providers and insurers from high-risk states stands to make things much worse throughout the year.

The statistics all point to the same conclusion: If you have a flood risk in the U.S. (and National Flood Insurance Program coverage isn’t sufficient), it can be impossible to get affordable coverage. This leads to big insurance gaps and massive losses. Drill into the statistics and you’ll find millions of lives and livelihoods that risk being destroyed when the water rises.

Sounds bad right? It’s not getting any better. Urbanization, increasingly extreme weather patterns and climate change are all making it harder to effectively underwrite flood policies. That means that alternative risk transfer solutions like parametric insurance must form part of the response. Without them, the flood insurance gap will continue to grow, and more and more livelihoods will be destroyed in the years to come.

The cost-of-living crisis

After several years of huge upheaval, many American businesses are feeling the financial strain like never before.

According to Aon data from October, 79% of business leaders think the country will face a recession in the next year. Only 35% claimed to be prepared.

Cash-strapped businesses find it harder to secure affordable coverage. Not only that, the rising price of recovery and claims inflation have put huge pressure on agents and their customers to make sure insured values are correct. This creates a perfect storm, where businesses can be paying higher premiums for coverage levels that don’t meet their recovery needs. When customers want to keep insured limits, our partner agents have reported rises of up to 300% in real term costs.

It’s not just brokers feeling the strain. Insurers are also under pressure to maintain a sustainable book. The threat of underinsurance can drive a wedge between insurer and customer, and when uncertainly looms, as it does for many flood risks, the answer is often a reduction in coverage and rising deductibles.

Parametric insurance offers an alternative from the trend of premium increases and limit issues. The premium benefits of parametric insurance are twofold. First, the increased simplicity and certainty in the underwriting (all claims values are known before a flood) means that capacity is more readily available in high-risk areas. Second, the flexibility that parametric policies afford mean that customers can select parametric triggers based on their risk and their budget.

See also: Property Underwriting for Extreme Weather

Investment in parametric coverage

The flood insurance market conditions are ripe, and customers are looking for greater flexibility. But can insurance providers deliver? The answer is an unequivocal yes. Investment in parametric solutions has seen massive growth in recent years. Equity raises by Descartes Underwriting, Parsyl and Arbol have set the stage for parametric market growth. The FloodFlash Series A raise announced last year only adds to the argument.

It isn’t just VC money that is capitalizing on the growth opportunity. Insurers and distributors are also getting in on the action. Reinsurance dollars dedicated to more exposed risks are shifting toward parametric providers. Similarly, brokers and agents across the country are hungry to learn about and distribute coverage that can help their clients most. According to Instech, nearly a third of the largest brokers globally mention parametric on their website, including half of the top 50 brokers. 

This investment of capital, expertise and platform will accelerate the growth in the years to come as parametric flood coverage goes from new entry to mass market. Experts recently interviewed by Wharton University Risk Management claim the flood insurance market “is so large and so underserved that there’s virtually limitless potential for growth.”

If you agree that parametric insurance holds the key to that growth, I’d love to hear from you.


Mark Hara

Profile picture for user MarkHara

Mark Hara

Mark Hara is the CEO of FloodFlash North America.

He has deep experience leading strategy, operations and product development with Fortune 100 companies — including Nationwide and P&G — and startups serving B2C and B2B customers to create profitable customer acquisition, engagement and retention.

Prior to joining FloodFlash, he was involved in two successful insurtech exits. At Mylo, he built and scaled sales, marketing, customer care and operations to create the #1 SaaS platform in commercial insurance.

Life Insurance Digitalized

Read the report to find out how life insurers are currently optimizing customer experience (CX) and client engagement throughout the policy lifecycle.

Life Insurance Digitalized

Delivering digital CX is a driving motivator of life insurers' digital transformation initiatives, but many operational and technological challenges must be overcome.

Read the latest study from Equisoft and Forester Consulting to find out how insurers are currently optimizing CX and client engagement throughout the policy lifecycle. See what challenges carriers still face as they progress through digital transformation and what technologies are most critical.

Download Now


Sponsored by Equisoft 


Equisoft

Profile picture for user Equisoft

Equisoft

Equisoft is a global provider of advanced insurance and investment digital solutions, recognized as a valued partner by over 220 of the world’s leading financial institutions in 17 countries. We offer a complete ecosystem of end-to-end and scalable solutions that help our clients tackle any challenge in this era of digital disruption. Our business-driven approach, deep industry knowledge, innovative technology, and expert teams help our partners solve their biggest, most complex problems. For more information, visit www.equisoft.com.