
The discourse around algorithm fairness has garnered increasing attention throughout the insurance industry. As the use of machine learning has become more common, from marketing and underwriting to claims management, regulators and consumer rights organisations have raised questions about the ethical risks posed by such technology.
A catalyst of this social discourse was an article titled Machine Bias published by the investigative news organization ProPublica. The paper focused criticism on a law case management and decision support tool used in the U.S. judicial system called Correctional Offender Management Profiling for Alternative Sanctions, or COMPAS.
A conclusion of the academic research surrounding this debate is that there are competing definitions of fairness, and these definitions may be incompatible with one another. The concepts of fairness at the center of the discussion are calibration (a.k.a. predictive parity) and classification parity (a,k,a, error rate balance). There is also the concept of anti-classification, which calls for sensitive (a.k.a. protected) attributes not to be explicitly used in decision-making.
A stylized example, designed for educational purposes, illustrates the intrinsic incompatibility of predictive parity and error rate balance. The example uses the Adult dataset, which figures prominently in studies on machine learning. Gender is the sensitive attribute of choice. It is demonstrated that a classification model that satisfies predictive parity across two groups cannot satisfy error rate balance if the baseline rate of prevalence differs between the groups.
The dataset, which is publicly available, comprises 48,842 anonymized records of annual income and personal information (such as age, gender, years of education, etc.) extracted from the 1994 U.S. Census database. The prediction task is to determine whether a person makes more than $50,000 a year.
In the dataset, 24% of individuals are high earners. This baseline rate is higher for males (30%) than for females (11%). The dataset has been an object of research for its imbalance on gender, as females make up only 15% of high earners but 33% of the entire data set.
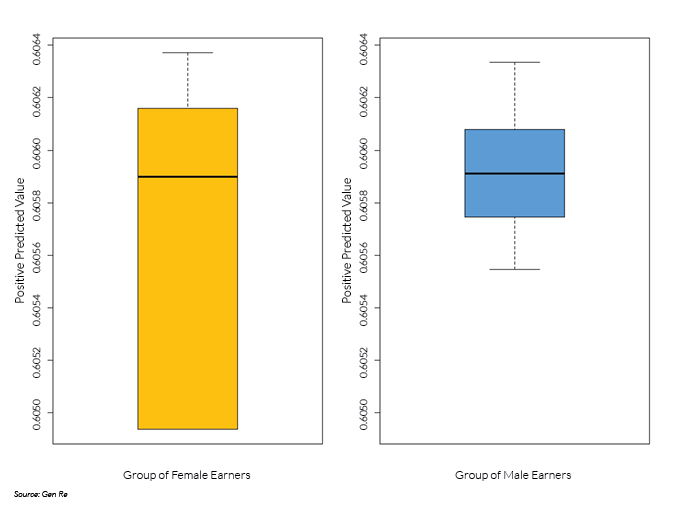
The algorithm satisfies predictive parity at a chosen threshold of predicted probability of being a high earner if in the category of predicted high earners the empirical probability of being a high earner is independent of group membership, where group membership is defined by the sensitive attribute. In plain English, the Positive Predictive Value (PPV), defined as the ratio of true positive count to the sum of true positive count and false positive count, must be equal across groups within an acceptable margin of statistical error. As shown in the box plot below, for a threshold of 32% of predicted probability of being a high earner, the (mean and median of the) PPV of the high-earner category equals 61% for both groups. In the box plot, the median is represented by a horizontal bar within the box, and the box marks the range between the first and third quartile.
Turning to the concept of error rate balance, the algorithm satisfies this concept of fairness at a chosen threshold of predicted probability of being a high earner if the false positive and false negative error rates, respectively, are equal across groups. A direct consequence of a scoring model satisfying predictive parity is that it violates error rate balance if the baseline prevalence differs across groups. Thus, despite satisfying the concept of predictive parity, the algorithm has a disparate impact on the two groups.
See also: The Challenges of 'Data Wrangling'
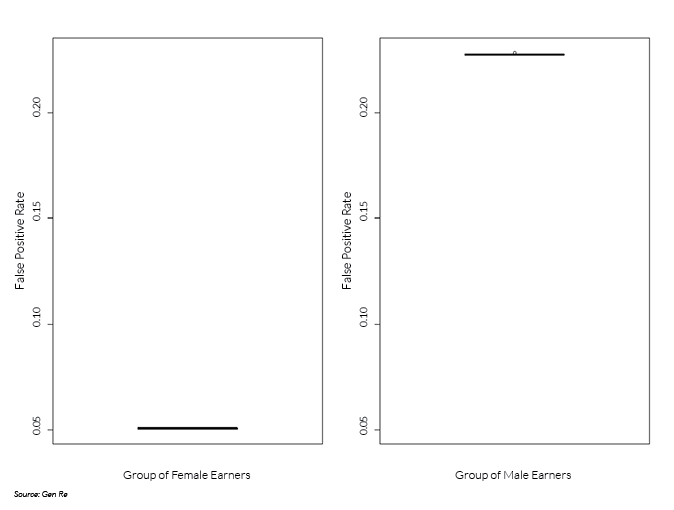
In the stylized example, the group of female earners has a lower rate of high income. Thus, in the presence of predictive parity, the group of female earners experiences a lower rate of false positives (see box plot below). Compared with a false positive rate of 23% for the group of male earners (median, displayed as horizontal bar within box in right panel), this rate equals 5.1% for the group of female earners (left panel).
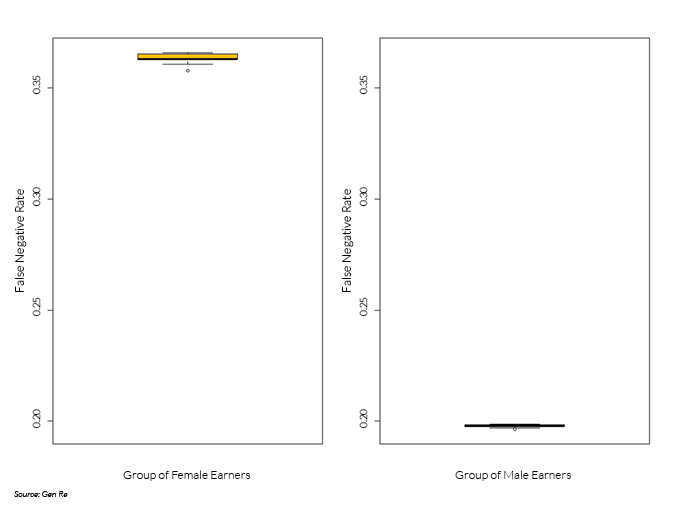
Correspondingly, the group of male earners experiences a lower rate of false negatives (see box plot below). Compared with a false negative rate of 36% for the group of female earners (median, displayed as horizontal bar within box in left panel), this rate equals 20% for the group of male earners (right panel).
In applying algorithms, it is important to recognize the trade-offs between different concepts of fairness and the presence of disparate impacts. Fairness is ultimately a societal, not a statistical concept. Insurers have an opportunity to shape the discussion on algorithmic fairness by demonstrating awareness of potential societal implications of their algorithmic decision-making.
This article first appeared at GenRe.com.