

For decades, the math governing property and casualty insurance distribution was straightforward: premium scale translated into market share, and heavy marketing budgets translated into digital reach. A carrier that dominated search results, television, and agent awareness could reliably occupy the top of the customer-acquisition funnel.
A new decision layer is now forming above that funnel. Buyers, agents, brokers, and business owners increasingly ask AI platforms to compare carriers, explain coverage, and recommend providers. Those systems do not return 10 blue links. They assemble a short, synthesized answer.
That distinction matters. A carrier can remain commercially large, rank well in traditional search, and still be absent when an AI system constructs the shortlist. Its legacy presence has not disappeared—but it can be bypassed at the moment of consideration.
To measure this emerging risk, Brainpan.AI's Q2 2026 Insurance AI Visibility Index™ tracked 137 insurance brands and scored 134 with sufficient measured data. The study tested 300 stratified prompts across ChatGPT, Gemini, Claude, Perplexity, and Copilot, producing 1,500 responses and 4,328 organic brand mentions. The benchmark measures whether brands are retrieved, placed prominently, recommended, and supported with visible evidence; it is not a ranking of carrier quality, financial strength, or customer value.

The Market-Share Illusion
The study's most commercially provocative finding is the decoupling between real-world market share and visibility inside AI-generated answers. Premium share remains an essential measure of commercial scale. It is not, however, a reliable proxy for AI mindshare.
Farmers illustrates the downside. In Auto, the carrier held roughly 3.6% of the real market, according to NAIC data, yet registered approximately 0.05% of measured AI visibility in the study—functionally absent relative to its commercial position. Amica illustrates the opposite pattern. Its Home AI visibility reached 7.6% against approximately 0.7% real market share, an overrepresentation ratio of about 10.8 times.
These examples do not prove that AI visibility causes premium growth or policy conversion. They establish something more immediate: market scale and machine visibility are now separate competitive assets. A carrier may lead one and trail badly in the other.
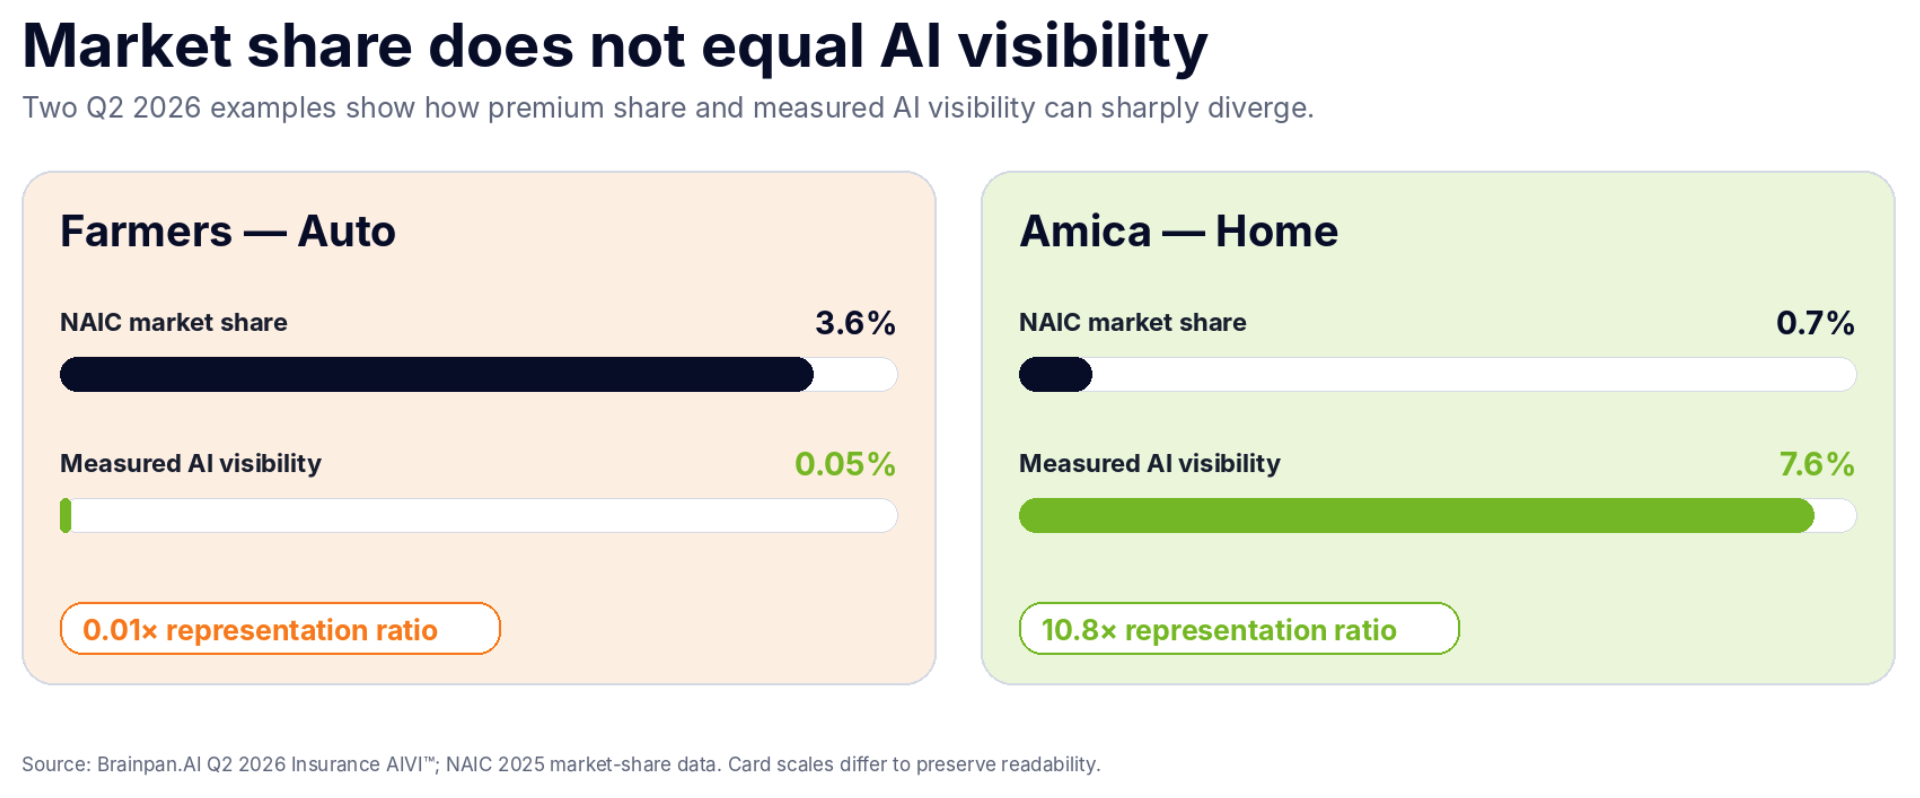
Figure 1. Real-world market share and measured AI visibility can diverge sharply. Farmers is severely underrepresented in Auto, while Amica is substantially overrepresented in Home.
Visibility Is Not One Metric
The benchmark also shows why a single mention count is insufficient. AI visibility has at least three distinct dimensions: reach, recommendation efficiency, and prominence.
State Farm led the study on reach, with 457 organic mentions. USAA appeared less often, but recorded a 46% recommendation rate—the highest among the overall Top 10 brands. The Hartford was the prominence outlier: although it ranked eighth in total organic mention volume, 88% of its appearances landed in the Top 3, the highest Top-3 rate among the overall Top 10.
These are different advantages. State Farm owns more of the answer layer. USAA converts a larger share of appearances into genuine recommendations. The Hartford is surfaced near the top when it appears. A carrier's reporting should separate all three rather than collapsing them into a single traffic or visibility number.
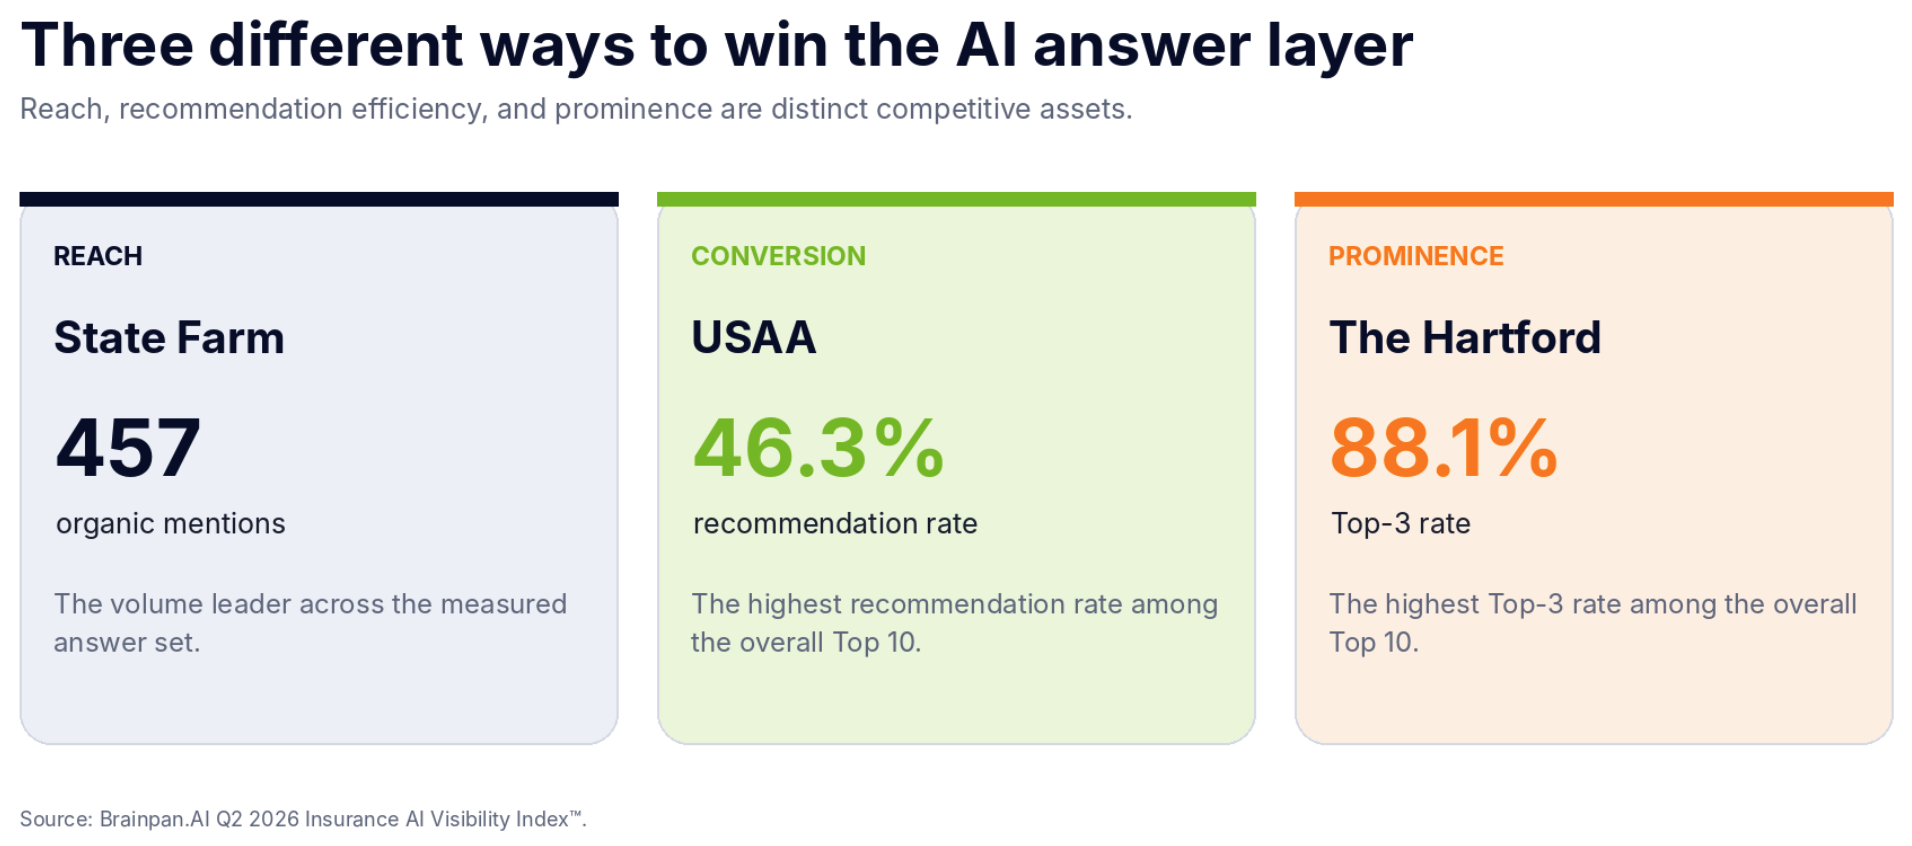
Figure 2. Reach, recommendation efficiency, and prominence describe different forms of competitive strength inside AI-generated answers.
Two Operational Drivers Leaders Should Examine
The benchmark measures outcomes, not the complete causal chain behind them. It nevertheless points to two operational areas that carriers should examine closely.
1. Machine-readable corporate and distribution information
This is not merely an IT plumbing issue. It is a distribution issue. Product availability, underwriting appetite, geographic eligibility, claims capabilities, and partner information are often fragmented across PDFs, portals, state pages, and loosely connected web content.
When public information is inconsistent or difficult to interpret, an AI system has less reliable material from which to construct an answer. Carriers should therefore audit whether their public-facing product and appetite information is explicit, current, consistently named, and easy for both humans and machines to retrieve.
2. Independent authority—not citation volume alone
The study also separates citation influence—how often an entity receives a visible citation—from independent authority, or how often that supporting evidence comes from a genuine third party rather than the entity's own domain.
That distinction can materially change the interpretation. NerdWallet received visible citations in 53% of its mentions, but only 7.3% of its mentions were independently backed after self-citation was removed. Several carriers showed the opposite pattern: lower raw citation frequency, but much stronger independent backing when they were cited.
The implication is not that owned content is unimportant. It is that raw citation counts can create false confidence. Carrier PR, regulatory references, independent analysis, authoritative industry media, and consistent third-party descriptions now form part of the evidence environment from which AI systems assemble answers.
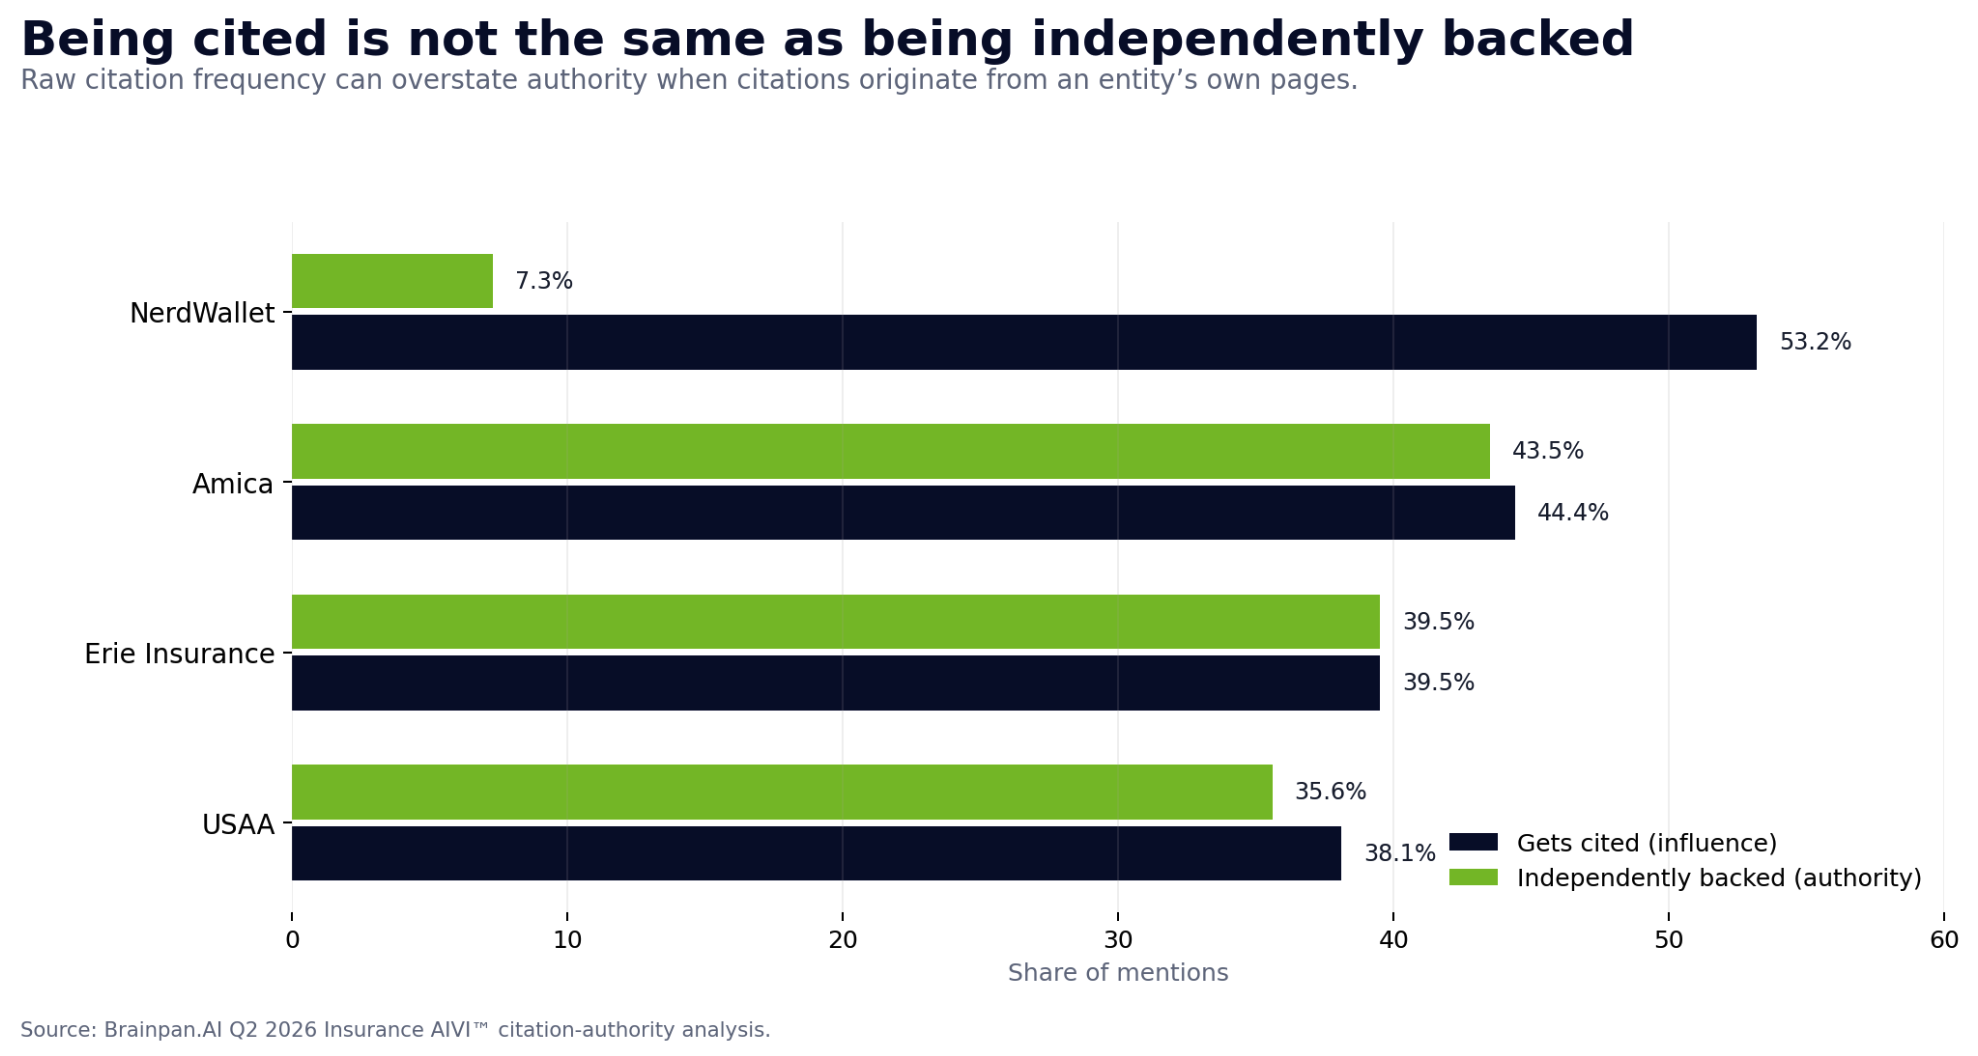
Figure 3. Citation influence and independent authority are not interchangeable. A high citation rate may still be driven largely by self-originated evidence.
The Monday-Morning Executive Checklist
AI visibility should not be delegated solely to the web or SEO team. It sits at the intersection of distribution, brand, product, communications, data governance, and customer acquisition. Three questions can quickly reveal whether a carrier is measuring the new risk:
- "Are we measuring our Share of Model against core competitors—or still relying only on traffic and click-through metrics?" A conventional dashboard cannot show whether a carrier is retrieved, recommended, or placed near the top of an AI-generated answer. Measurement should separate reach, recommendation, prominence, citation influence, and performance by engine and product line.
- "Is our public-facing underwriting appetite and product information explicitly formatted for machine consumption?" Making distribution information accessible to human agents is no longer sufficient. Public content should use consistent entities, clear eligibility language, current product definitions, and structured relationships that answer systems can reliably interpret.
- "What is our strategy for building independent digital authority?" Owned content remains necessary, but it is not enough. Carriers need a deliberate evidence strategy across regulatory sources, respected industry publications, analyst coverage, partner ecosystems, and other credible third-party environments.
A New Competitive Layer
AI answer engines are not replacing every existing channel. They are adding a new layer to insurance discovery and consideration—one that can reshape which carriers enter the shortlist before a prospect visits a website, contacts an agent, or begins a quote.
Scale will remain an asset in property and casualty insurance. But scale must now be translated into machine-legible product information, visible recommendation strength, and independently supported authority. The carriers that win this layer will not simply be the ones with the largest balance sheets. They will be the ones whose expertise, appetite, and credibility are legible to the systems assembling the decision set.
Research note: The Brainpan.AI Insurance AIVI is an organic-only benchmark. Paid placements were identified and excluded from organic scoring. The composite weights Share of Model at 35%, recommendation strength at 25%, position weighting at 20%, citation influence at 15%, and Top-3 rate at 5%. Results represent a controlled Q2 2026 prompt sample and should be interpreted as a visibility benchmark, not as proof of revenue, quote, CAC, or policy impact.