The Equal Ventures Insurance Index is a quarterly summary of insurance equity performance and trends. We’re back to reflect on the insurance/insurtech ecosystem in Q3, which turned out to be a fairly meaningful quarter in terms of both price action and industry news.
Q3 Headline Summary
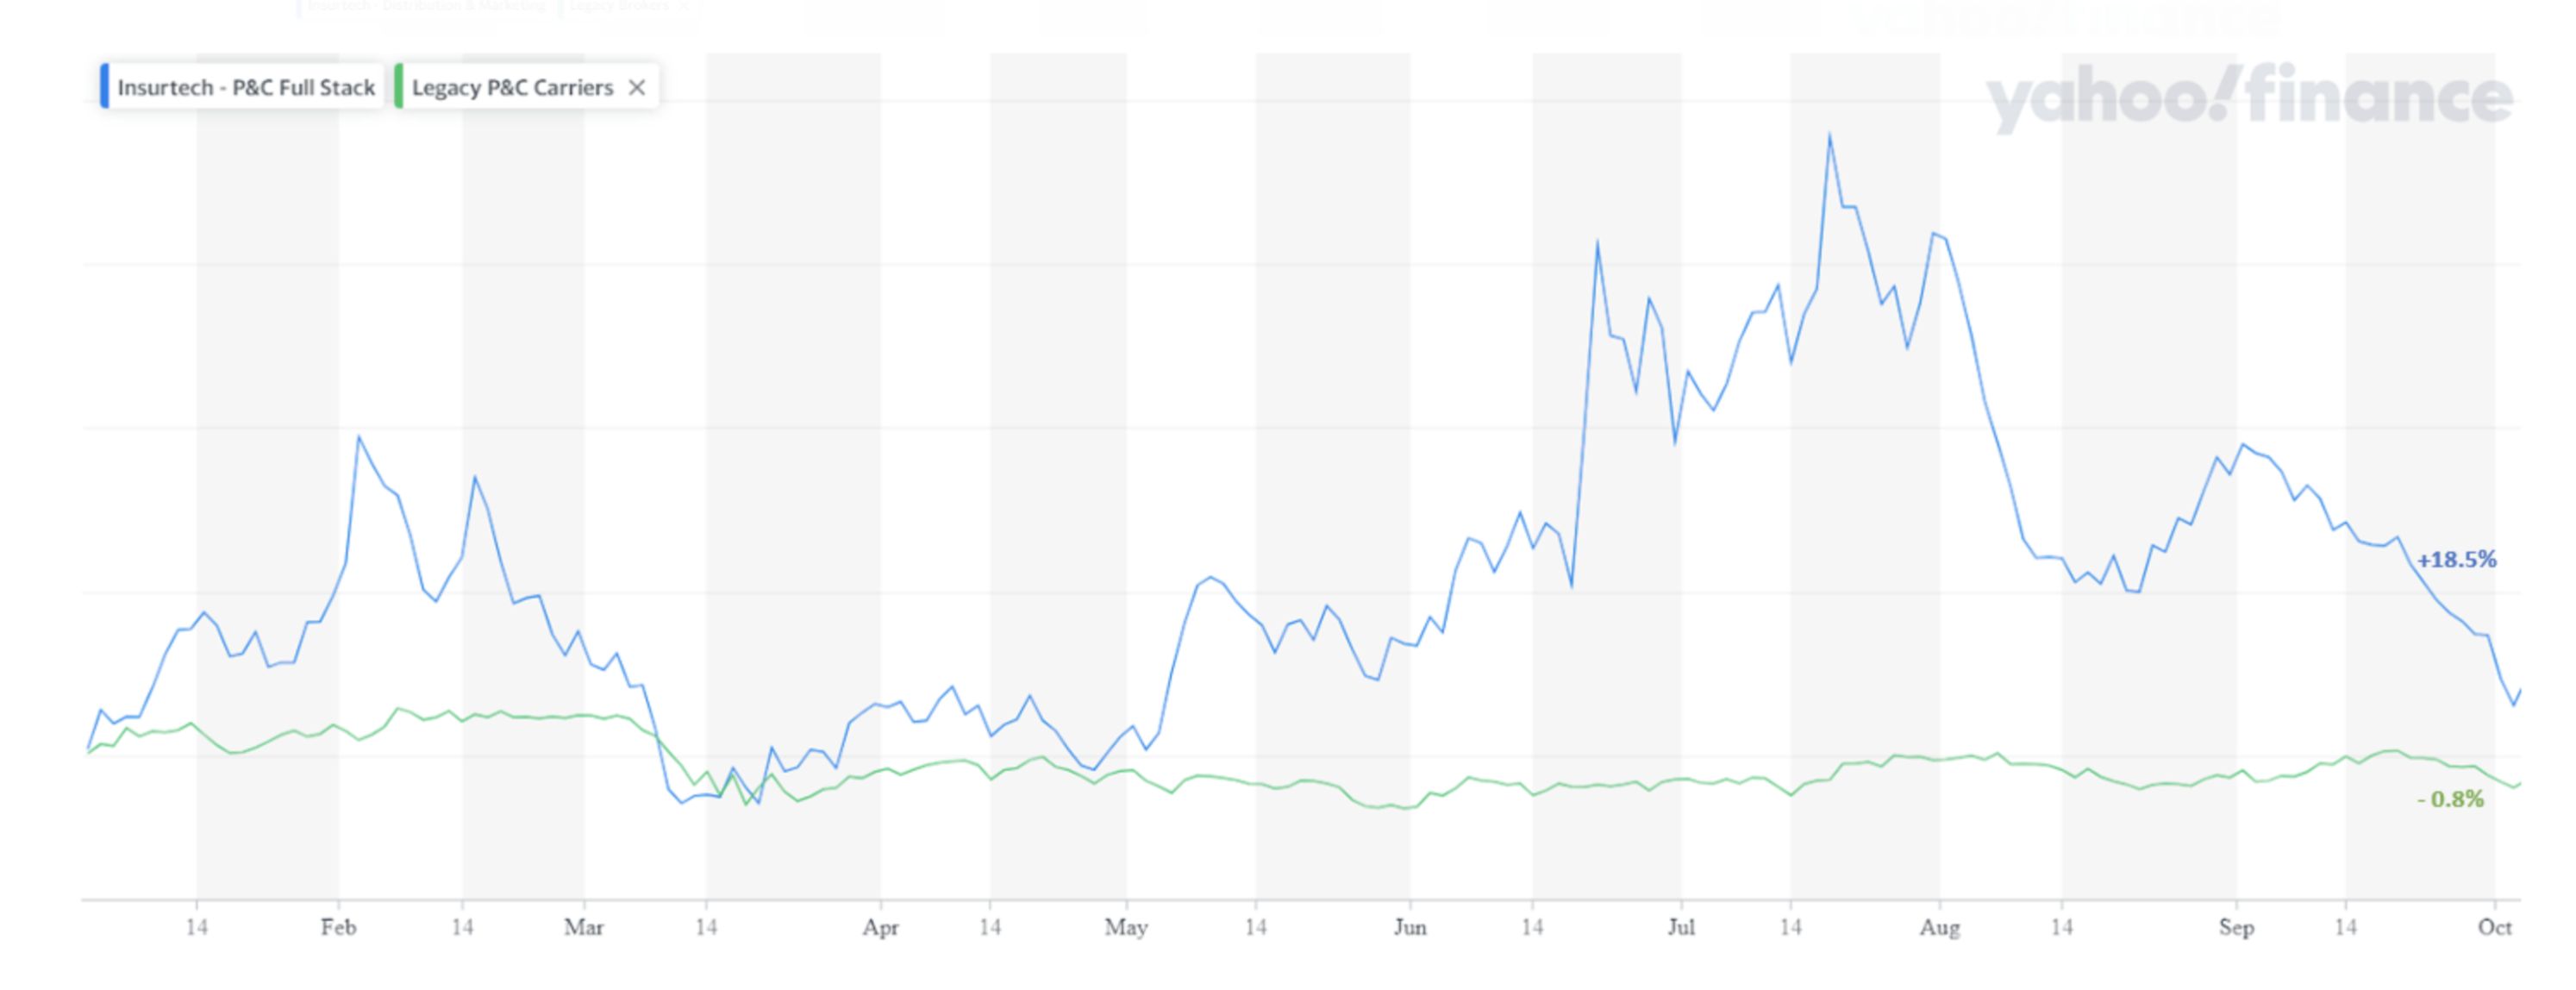
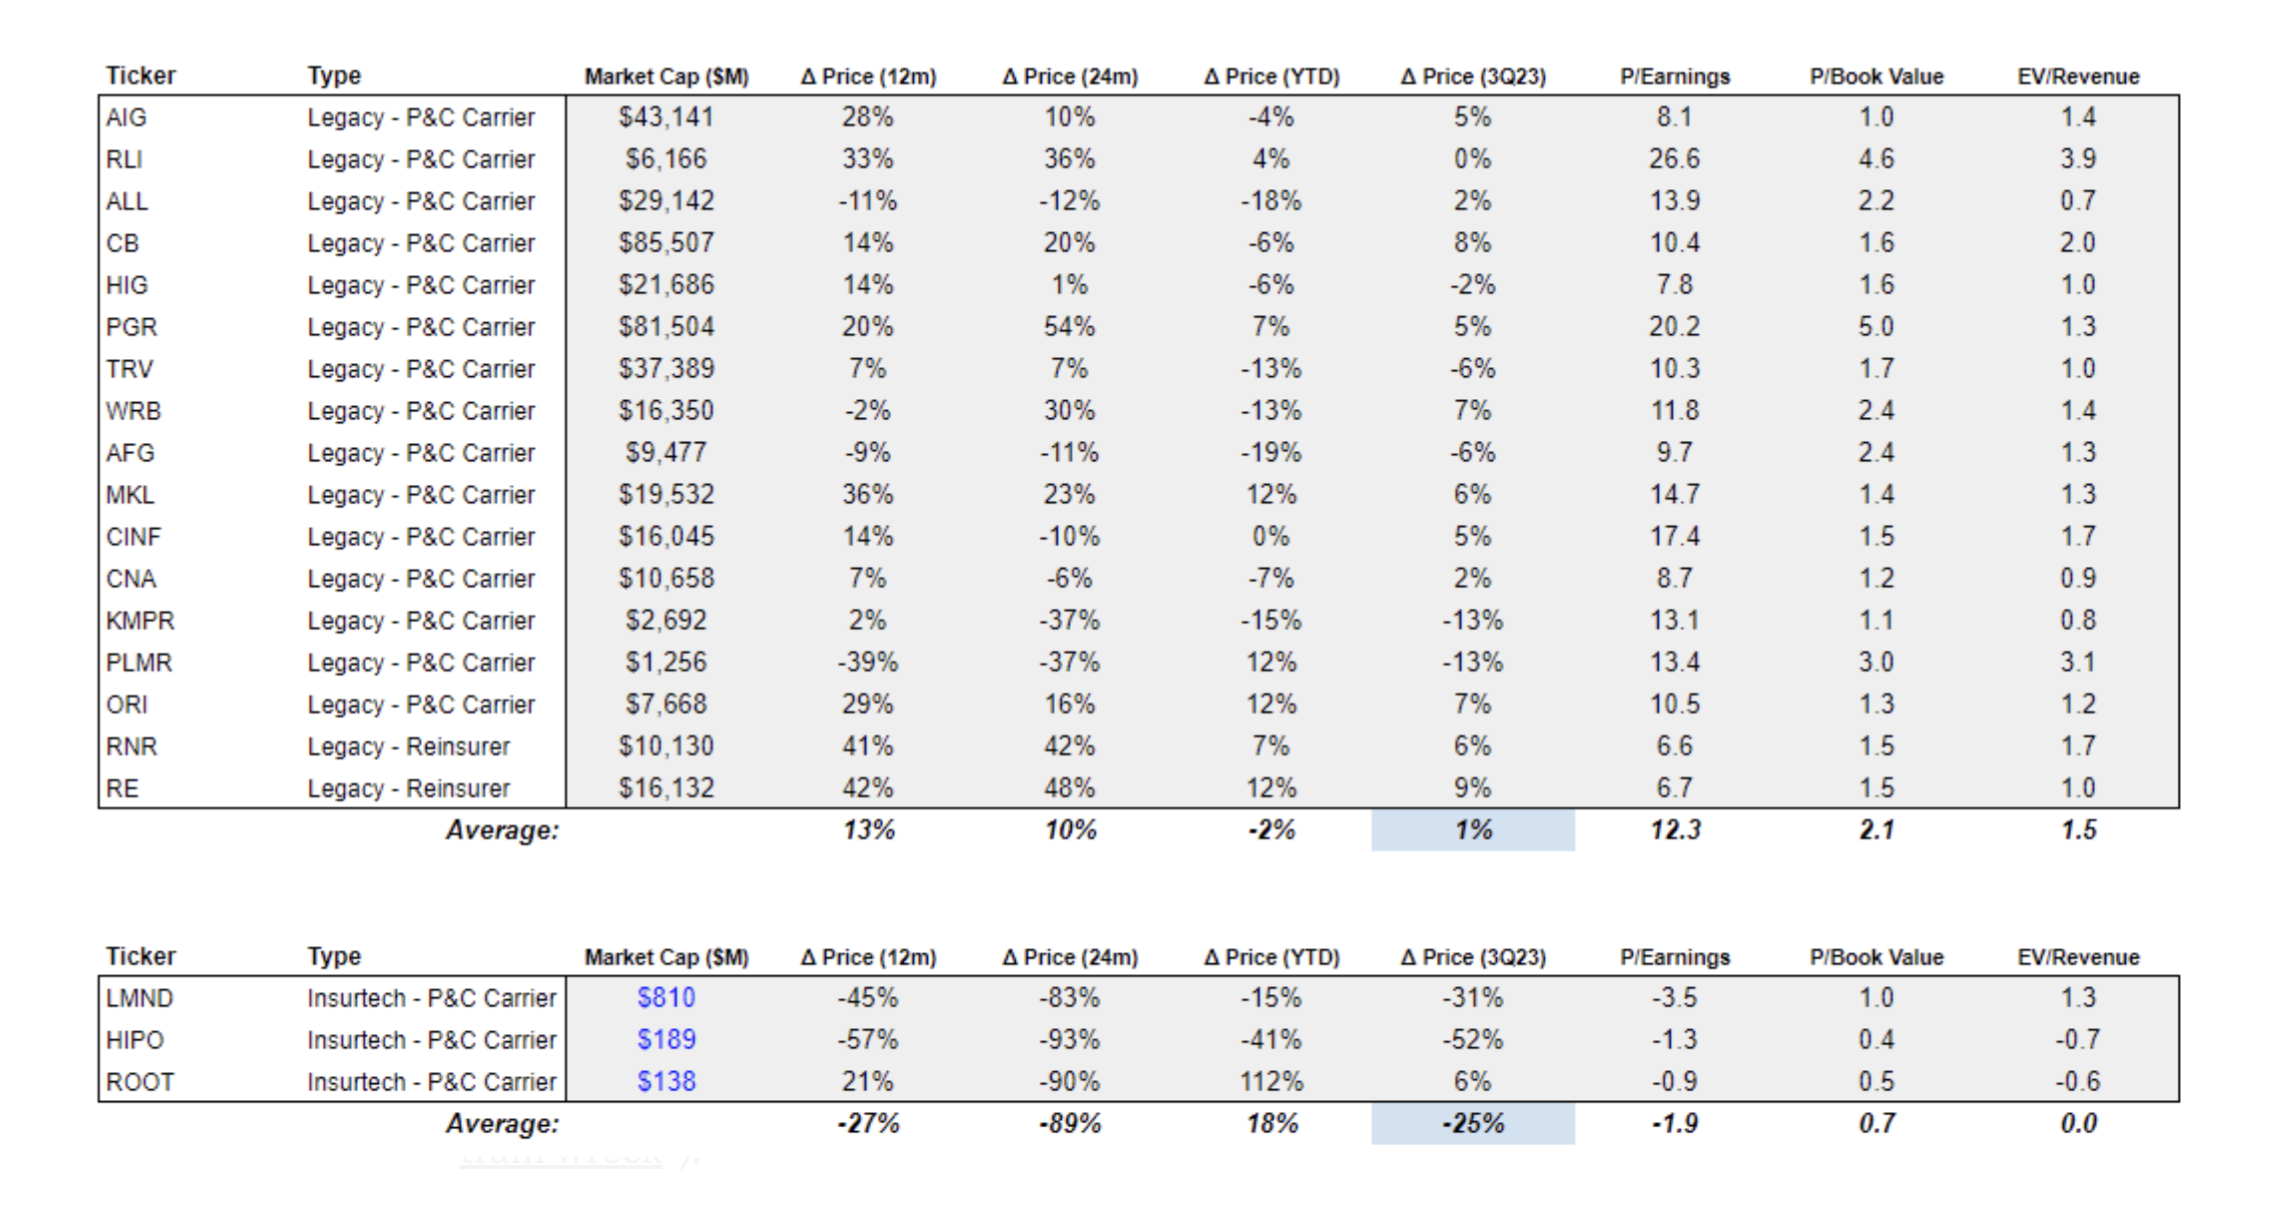
- In Q2, we noted that insurtech carriers rebounded and outperformed; this trend reversed sharply over Q3, as the insurtech carriers in our index were hit by rising loss ratios and the resulting deceleration in growth.
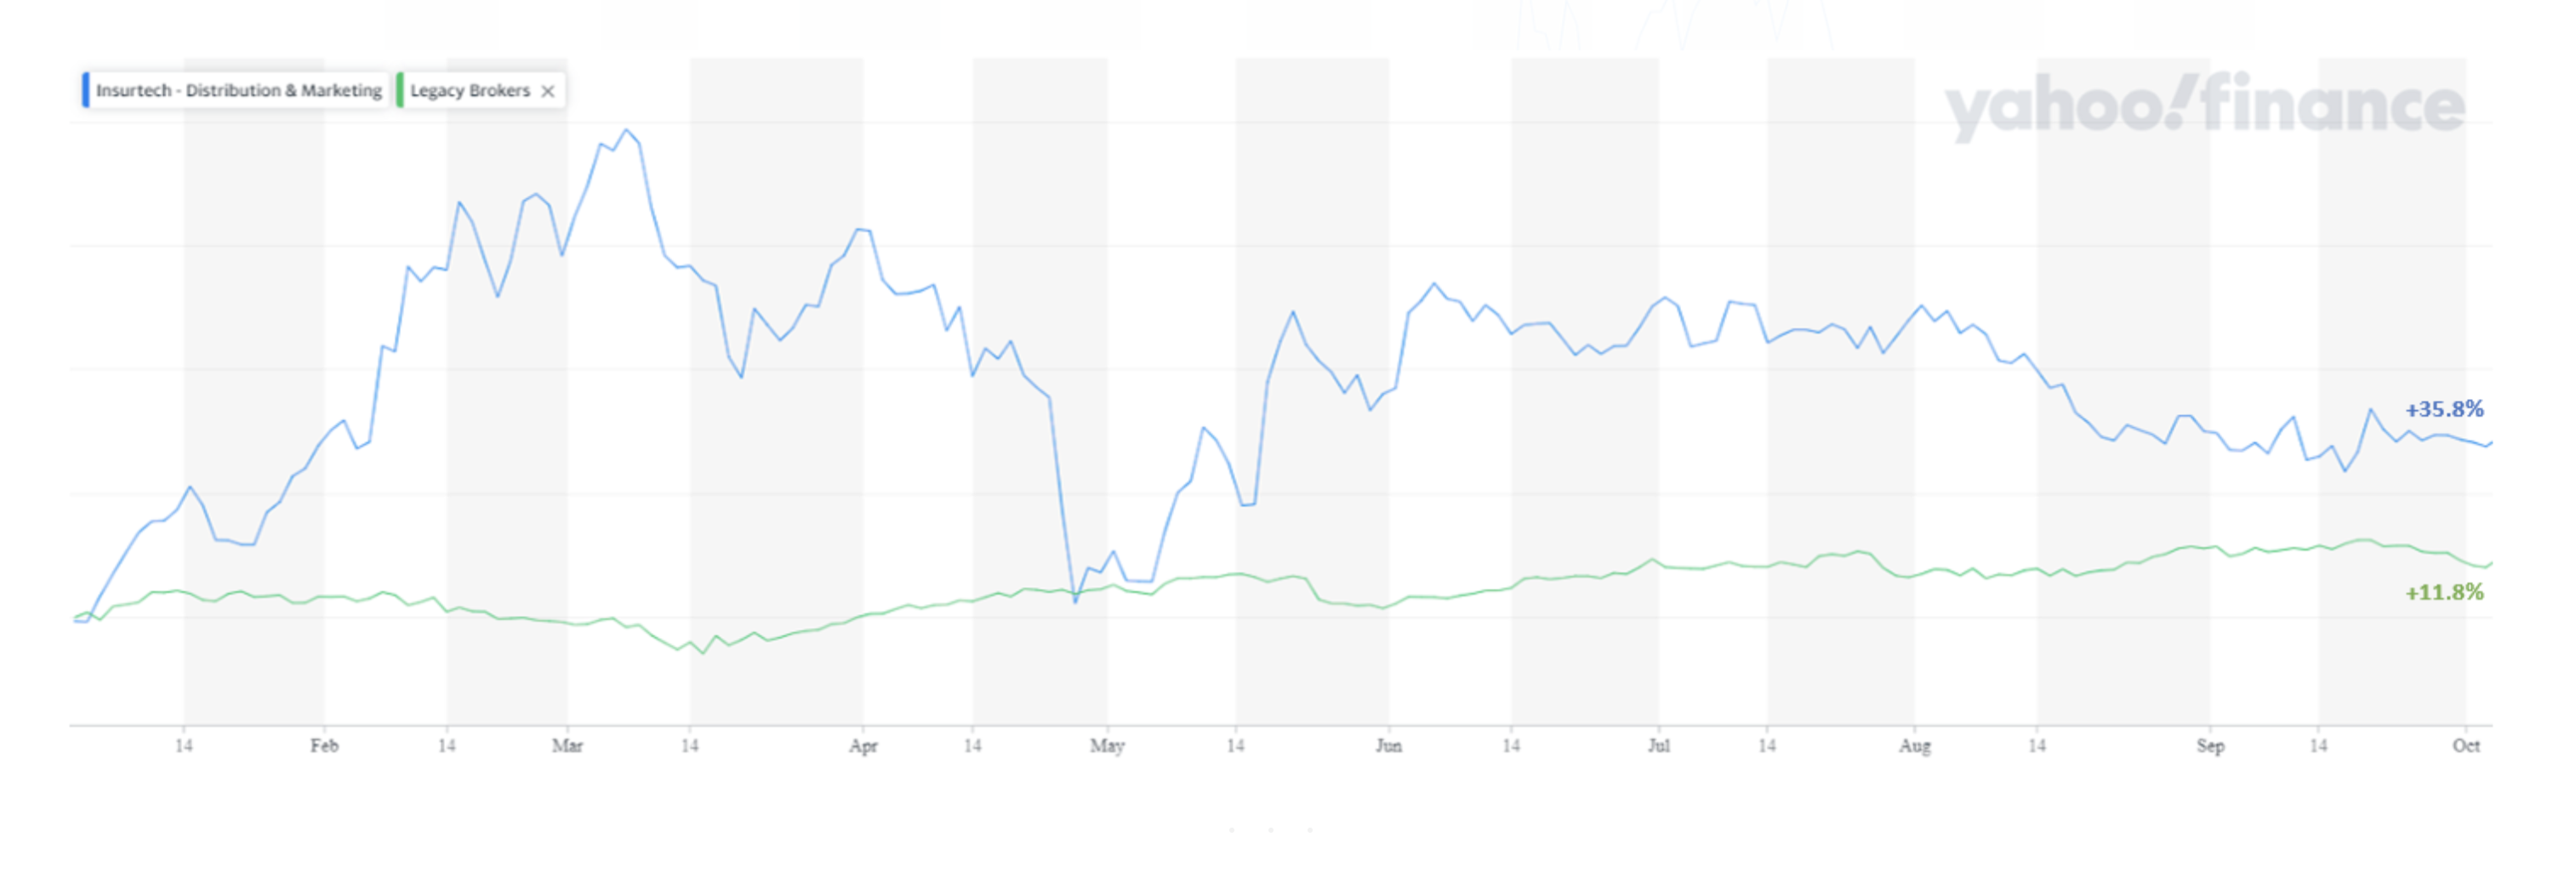
- Digital brokers once again underperformed their legacy peers, most likely dragged lower as the broader market traded sideways, signaling risk-off for most of small-cap tech.
- YTD, insurtechs and digital challengers have outpaced their legacy comparables, but the spread in YTD performance narrowed significantly in Q3 (so much for a quick path to valuation recovery…).
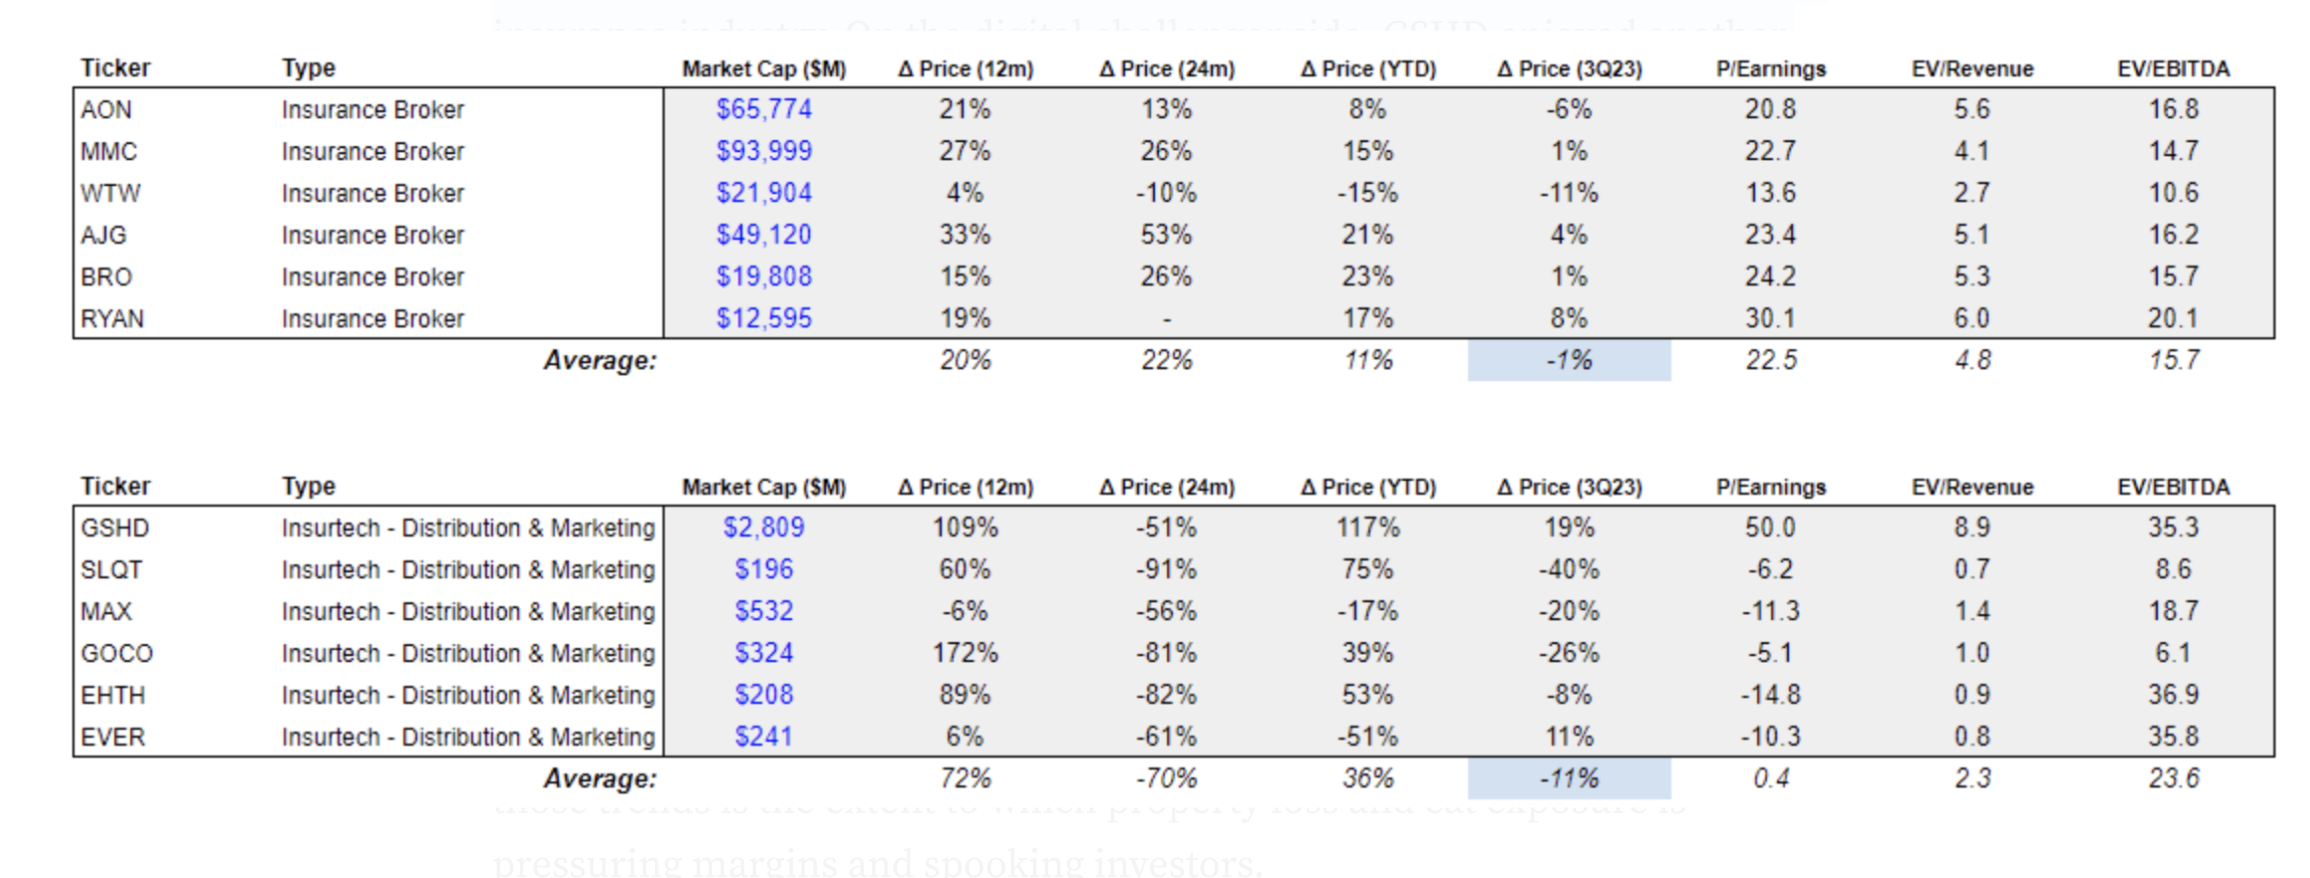
- Legacy brokers and P&C insurers were, on average, flat over the quarter, mirroring the broader market (and also masking larger continuing trends that we discuss in greater detail below).
Takeaways from Q3 Performance
Brokers continue to face a favorable environment as rates trend higher. The legacy names were flat on average in an otherwise choppy market. The index was dragged down by WTW, which reported lower margin and reduced guidance in Q2 earnings in part due to increased investments in talent — pointing to a broader trend in talent management that affects the insurance industry. On the digital challenger side, GSHD enjoyed another quarter of massive outperformance compared with the digital distribution peers we track it against and expanded its already outsized EPS and EBITDA multiples. The lead-gen and digital acquisition companies, on the other front, continued to underperform and for the most part traded sharply lower.
In the P&C carrier segment, observations from Q3 performance highlight a number of powerful and secular trends affecting the industry– chief among those trends is the extent to which property loss and cat exposure is pressuring margins and spooking investors.
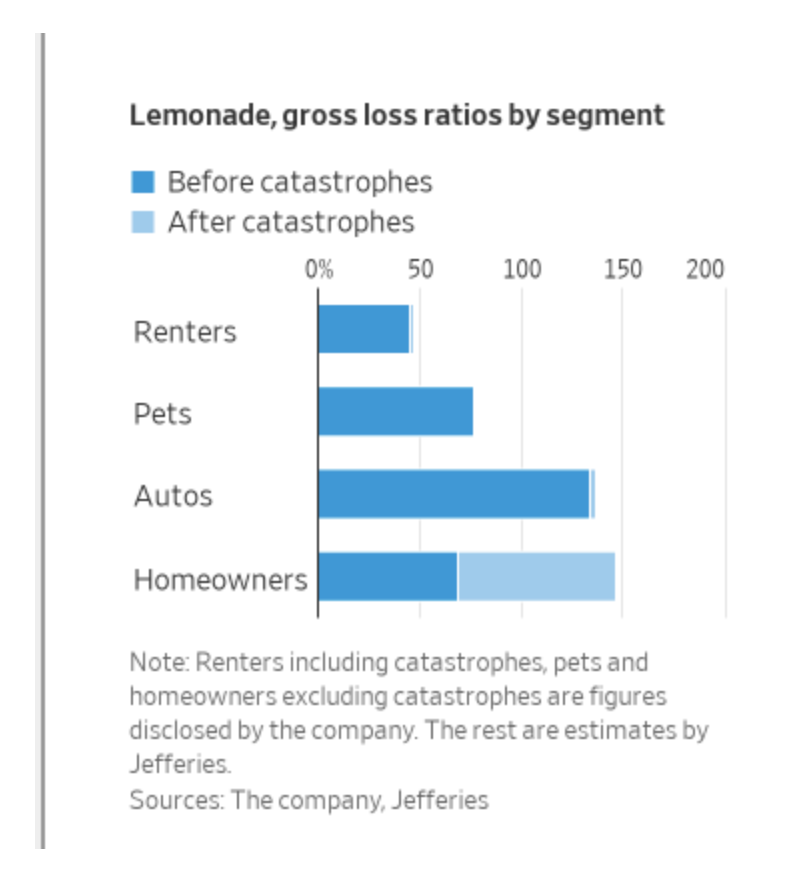
Performance of the volatile insurtech carriers demonstrates this trend. LMND started the quarter strong, after catching a bid from its “synthetic agents” initiative as an opportunity to improve cash efficiency and accelerate growth. But the stock fell off a cliff (and hit all-time lows) after posting higher loss ratios driven by cat exposure in its homeowners segment and announcing reduced reinsurance coverage. As a result, the company announced it would slow growth while waiting out new rate filings/increases. This is likely the responsible thing to do but not at all what investors were looking for. The chart below shows the magnitude of the homeowners losses before/after cat losses.
See also: Lemonade's 'Synthetic Agent' Nonsense
HIPO performance tells a similar, if not exaggerated, story about destabilizing cat risks. HIPO reported elevated cat losses attributed to TX hail, and like LMND, made a commitment to slowing growth while rates increase. But shortly after earnings, HIPO abruptly announced an immediate and unprecedented pause of all new business while they “evaluate catastrophic risks, geographic diversification and enhanced underwriting…” Unsurprisingly, their stock fell more than 50% over Q3.
Importantly, the trend toward higher property cat losses was not limited to the volatile insurtechs. National carriers continued to exit the CA and FL markets, a trend that started making headlines in Q2. Alarmingly, a greater share of homeowners are forgoing insurance due to cost or accessibility, and there is an increasing reliance on public insurers of last resort (a trend aptly described by a CA insurance industry group last month as a “slow motion train wreck”).
But even outside of these hardest and most disrupted markets, carriers are grappling with increased nat cat event frequency and higher exposure. In the wake of the unstable and disorderly reinsurance renewals market earlier this year, carriers landed with less reinsurance coverage overall (and therefore more exposure to cat risks). At the same time, more conservative reinsurance contracts left carriers with higher retentions and more exclusions to unnamed storms and secondary perils. 2023 turned out to be a particularly active year for severe convective storms — exactly the type of unnamed, moderate-frequency events that carriers are more exposed to due to reinsurance constraints (and exactly the type of non-coastal property losses that HIPO and LMND referenced). Losses from named storms, on the other hand, for which reinsurers bear more risk, have (so far) been relatively subdued. As a result primary carriers faced losses in Q2 as much as 40% above normal, whereas reinsurers effectively enjoyed a windfall from higher rates and below-average loss. This explains both the volatility across P&C carriers in the index, as well as the outperformance of reinsurers.
See also: Insurtech Startups Are Doing It Again!
Beyond property insurance, in a market with reduced access to reinsurance and continuing claims inflation, specialty insurers and brokers continue to take share from the admitted market. Commercial carriers with outsized E&S lines continue to outperform carriers in admitted segments. KNSL, a pure-play E&S carrier (and therefore not part of our index) trades at >2.5x the earnings multiple of our legacy carrier index. As we’ve written about before, it’s up ~60% YTD through Q3 and points to a long-term shift toward specialty risk and niche commercial underwriting expertise. Commercial rates continued to increase in Q3, though the pace of rate growth decelerated sequentially, possibly pointing to more stability for carriers in the quarters ahead.
As a reminder, the purpose of this brief (and oversimplified) analysis is to share high-level trends for insurtech investors, and not to comment definitively on valuations or market expectations. That said, we believe it will be instructive to see how insurance equities fare in Q4, and we note that insurtech carriers appear to be struggling from similar macro trends that are affecting the P&C industry at large. Whatever happens, it is clear that controlling property losses will continue to take on increasing importance for both legacy carriers and digital challengers.