
Synopsis/Summary: This executive briefing looks at the relationship between overall inflation and insurance replacement costs in six of the world’s largest insurance markets: the U.S., Canada, the U.K., the E.U., Japan and Korea.
Specifically, the briefing’s analysis focuses on P&C/non-life replacement costs for commercial and personal property and personal and commercial vehicles including construction materials, auto and auto parts and labor. The results provide correlation estimates across and within each country, organized first around property and then vehicles, identifying statistically significant and non-significant coefficients that confirm and question received expectations.
The briefing’s analysis builds on the authors’ research at the Insurance Information Institute on overall inflation and P&C replacement costs in the U.S. Applications include business strategy, planning, and maximizing underwriting performance and solvency during times of economic stress such as the current high inflation environment.
* * *
Key insights into the relationship between inflation and insurance replacement costs as basis for P&C / Non-Life capital allocation line performance, and solvency
This executive briefing looks at the relationship between inflation and P&C/Non-Life insurance lines in the United States, Canada, the United Kingdom, the European Union, Japan and Korea. It aims to provide the reader preliminary insight into the quantitative relationship between overall inflation and insurance replacement costs within and across the covered countries. We define insurance replacement costs, as opposed to a country’s overall inflation, as the average increase in prices for specific goods and services paid by a P&C/Non-Life towards repair and rebuild costs for total losses paid.
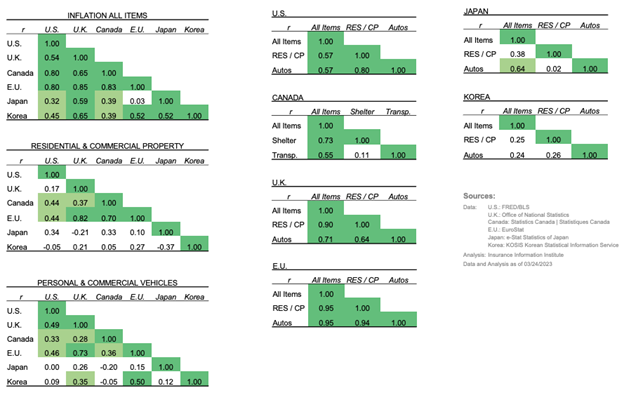
Correlation patterns for changes in residential and commercial property replacement costs identified three distinct groups: the U.S., Canada and the E.U. were correlated to one another with different degrees of significance, while Japan and Korea showed no significant correlation to one another or any of the other countries. Personal and commercial auto correlation patterns also identified three distinct groups overlapping with those of property, though Korea showed some significant correlation with the U.K. and the E.U.
Quantifying the relationship between inflation and insurance replacement costs across national and regional P&C/Non-Life insurance markets can provide an additional framework to maximize insurance capital allocation, including reinsurance capacity, by seeking uncorrelated underlying economic fundamentals and insurance performance metrics. Further, separating correlated and uncorrelated line-specific insurance replacement costs drivers can increase the ability to forecast line-specific performance metrics and provide added guidance to industry stakeholders, including regulators, seeking to maximize liquidity and solvency during times of economic stress such as the high inflation that characterized the COVID-19 pandemic and its aftermath.
In a very preliminary manner, the correlation analysis reported in this briefing indicate that it may be possible to minimize the impact of historically high increases in P&C/Non-Life replacement costs by diversifying exposure to property and auto lines by selecting different insurance markets based on the extent of correlation between overall inflation and replacement costs across and within countries. For example, pending further research and validation, grouping the six countries we reviewed into three cohorts may reduce the drag of historically high replacement costs on individual lines’ performance metrics; these cohorts being the U.S., Canada, the U.K. and the E.U.; a stand-alone Korea; and a stand-alone Japan.
In the U.S., the difference between increases in overall CPI versus changes in insurance replacement costs has proven to be significant. Between 2019 and 2022, increases in P&C replacement costs averaged twice that of the overall CPI. Given this spread, insurance replacement costs baskets are becoming a more precise and timely input into forward looking loss estimates and the impact of inflation on line-specific performance metrics.
This briefing is divided into four sections. First, it introduces the distinction between overall inflation and insurance replacement cost and its relevance to our understanding of how macroeconomic fundamentals drive insurance performance.
It then seeks to identify and quantify correlations between overall inflation and replacement costs within and across the sample countries, for property and then autos. The analysis of property and auto replacement costs, the core of this briefing, provide descriptive year-over-year and year-over-five-year inflation estimates, and correlation analysis of the relationship between price changes for each line within and across the covered countries. The last section describes the methodology including additional inflation and correlation graphs and tables.
This briefing’s scope is limited: it explores correlations between overall inflation and replacement costs for property and auto only; restricts itself to descriptive statistics rather than inference; and pairs inflation components from different national inflation metrics indices even though those may not fully overlap in their individual definitions. The methodology section expands on these insight and limitations.
This briefing’s analytical framework draws from Triple-I’s research into the relationship between overall inflation and insurance replacement cost in the United States over the last three years. That methodology deconstructs the U.S. CPI Urban-all items into separate goods and services baskets aiming to be most representative of specific insurance lines’ “repair and rebuild” costs.
Residential and Commercial Property
 The U.S. experienced the highest five-year cumulative inflation between 2018 and 2022 of the cohort. Over that period, overall U.S. inflation on a cumulative basis reached 20.7%. The U.S. was closely followed by the E.U. at 20.31%, the U.K. at 17.7%, Canada at 17.0%, Korea at 11.9%, and Japan at 3.3%. This stands against a backdrop of correlated overall inflation across the six countries. This is against a backdrop of overall inflation correlated to various significant degrees across the U.S., Canada, the U.K., and Korea, but not across those countries and Japan and the E.U.
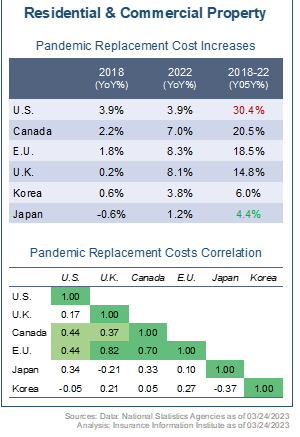
Cumulative increases in property replacement costs were higher than overall inflation in the U.S., Canada and Japan. Conversely, overall inflation was higher than increases in property replacement costs in the U.K., the E.U. and Korea.
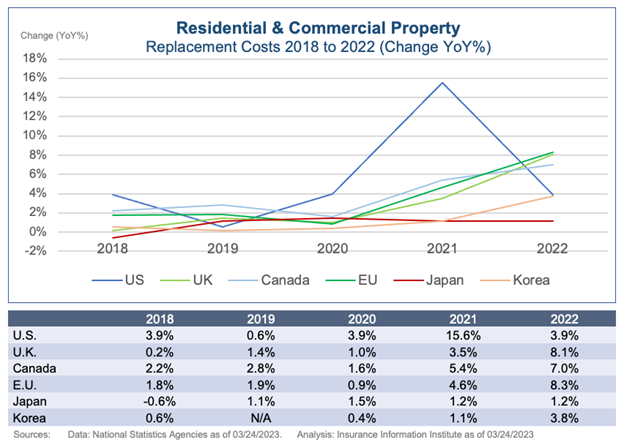
Over the same period and across the six countries, the U.S. experienced the highest cumulative increases in property replacement costs at 30.4%, followed by Canada, the E.U., the U.K., Korea and Japan. Property replacement costs correlations grouped the six countries into three cohorts: the U.S., Canada, the U.K. and the E.U.; a stand-alone Japan; and a stand-alone Korea. The four countries in the first cohort show different degrees of correlation significance with one another while the second and third cohorts show no correlation with either of the other cohorts or any of the other countries. Within the first cohort, Canada is strongly correlated to the E.U. Property replacement costs in Canada are strongly correlated to the E.U.’s but weakly to U.S.’ and the U.K.’s.
Summary rational for the above relationships include the relative weight of property cost drivers within each country’s inflation baskets, construction material sourcing, free-trade blocs and domestic credit intermediation to name a few. We suggest further review.
Personal and Commercial Auto
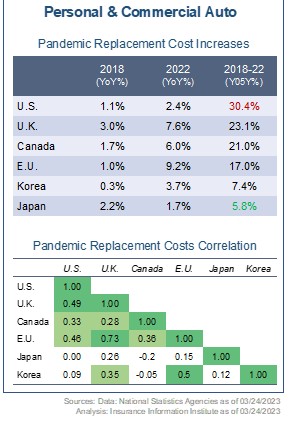 Looking at the relationship between auto replacement costs and inflation within each of the six countries from 2018 to 2022, replacement costs correlate with overall inflation in the U.S., Canada, the U.K., and the E.U.. However, they do not correlate with overall inflation in Japan and Korea. Cumulative increases in auto replacement costs were higher than overall inflation in the U.S., the U.K., Canada, and Japan. Conversely, overall inflation was higher in the E.U., while Korea saw auto replacement costs increase less than overall inflation.
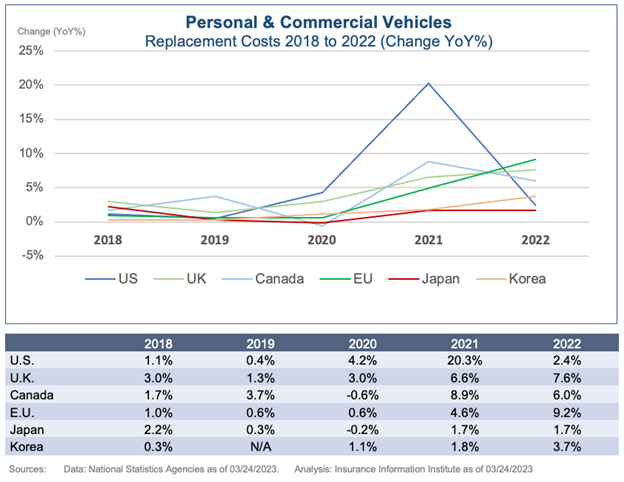
Over the same period and across the six countries, the U.S. experienced the highest cumulative increase in auto replacement costs at 30.4%, followed by the U.K., Canada, the E.U., Korea and Japan. Auto replacement costs correlations grouped the six countries into three cohorts: a first cohort with different degrees of significant correlation between the U.S., the U.K., the E.U., and Canada; a second cohort between Korea, the U.K., and the E.U.; and third cohort made of a stand-alone Japan. Within the first cohort, the strongest correlations are between the E.U. and the U.K., then those two countries and the U.S., and only last yet still significant the relationship between those three countries and Canada.
Even though it is beyond this briefing’s scope to move from descriptive statistics to inference, it is worth noting that supply chain integration seems to have less impact on replacement costs than might have been otherwise expected. The weaker yet significant correlation between replacement costs in the U.S. and Canada, which arguably share a single supply chain, compared to the stronger correlation between replacement costs in the lesser chain-integrated U.S., U.K., and E.U., point to the other determining intermediary variables. We suggest further review.
Methodology and Technical Notes
Aligned with the Triple-I’s mission to provide actionable data-driven insight to the P&C industry, our replacement costs framework uses publicly available government data for the major level-1 CPI or PPI components, those just below the index itself. In its current form, the selection of basket components is based on claims patterns and major categories for repair and rebuild by line. The recomposed line-specific baskets are weighted to qualitatively match loss patterns. We are currently using machine learning trees to optimize both the selection and the weighting of each line-specific basket. We expect to publish preliminary results of this analysis this summer.
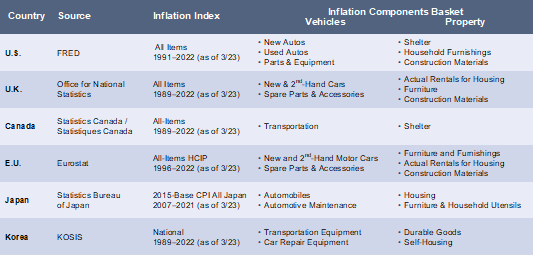
We chose to gather data directly from national statistical reporting agencies rather than rely on international agencies or multi-laterals. This decision was based on data availability and timeliness, consistency and familiarity for economists following each country, and better control over inflation basket component selection and taxonomy. We acquired roughly thirty years of data from national statistical agencies where possible or, otherwise, as much as was available. Because there is little international uniformity in inflation reporting, we had to find approximates and equivalent data to the lines we use in constructing replacement costs estimates for individual U.S. P&C lines.
Given the constraints under which we were working, we were unable to access inflation data for specific consumer items in Canada, and instead used the generalized categories of Shelter and Transportation, which include often-volatile fuel price data. Japanese data was only available starting in 2007 and, due to reporting lags, lacked 2022—this was the most limited country in the analysis cohort. In addition, we had trouble accessing data relating to construction materials. It is worth noting that much of the data for E.U. was available, but referred to by different labels (i.e., Second-Hand Cars instead of Used Autos, or Actual Rentals for Housing instead of Shelter). This data was otherwise equivalent.
Once monthly index data was acquired, the rate of inflation for each year was calculated as the percent change from December of the previous year to December of the year in question for each data series. This is in keeping with the generally accepted practices of reporting annualized inflation. In addition to translating the raw data into the more familiar inflation rates, this also deserialized the data and made erroneous correlation less likely. To calculate inflation over several years, we calculated the product of the inflation rates of the intermittent years.
Homeowners and Auto replacement costs were calculated as the unweighted averages of housing-related inflation rates and auto-related inflation rates, respectively. With the lines of business aggregates calculated, we generated correlation matrices across-country for each line-of-business plus overall inflation, and within-country matrices across data series. Since correlation coefficients require paired data, each pairing of country was limited to the lesser of the pair. For example, since Japan had the fewest observations, its pairings were limited to 14 observations.
We also calculated the p-values of each correlation based on the t-distribution to evaluate the robustness of each correlation coefficient. (The p-value represents the probability of making a false-positive error in examining statistical measurements, thus the lower the p-value the more robust the measurement is). We labeled correlations with p-values between 0.10 and 0.01 as weak (colored light green), and correlations with p-values less than 0.01 as strong (dark green). This is consistent with regular practices in academia.
The matrices of correlation coefficients were color-coded based on coefficient robustness, providing a road map for examining the relationships between countries, input sources, and how trends in one country can cascade through supply-chains. There are some obvious limitations to relying on correlations; however, this provides a manageable survey of connections and trends, and represented the first step one would take in developing more causal links.
* * *
By Michel Leonard, PhD, CBE, Chief Economist & Data Scientist, and Riley Conlon, Research Analyst,
The Insurance Information Institute
The Insurance Information Institute reserves the right to change, improve or correct the information, materials and descriptions in this report. The information contained herein is the work of Triple-I analysts and contains information from third party sources. Triple-I gives no guarantees, undertakings, or warranties concerning the accuracy, completeness, validity, or timeliness of the information provided. Independent confirmation of the accuracy of the information contained herein is recommended. Any dated information is published as of its date only.
5.2023
About the Authors:

Michel Léonard
Chief Economist & Data Scientist
The Insurance Information Institute
Dr. Michel Léonard, CBE, is the Insurance Information Institute’s Chief Economist and Data Scientist. He brings more than twenty years of insurance experience including senior and leadership positions. In these roles, he worked closely with underwriters, brokers and risk managers to model risk exposures for property-casualty and specialty lines such as credit, political risk, business interruption and cyber. Dr. Leonard is also Adjunct Faculty in New York University’s Department of Economics. He is a member of the Insurance Research Council Advisory Board.

Riley Conlon
Research Analyst
The Insurance Information Institute
Riley Conlon joined Triple-I’s Economics and Analytics Department as a Research Analyst. He is responsible for providing analysis and insight on insurance and economic conditions, and developing forward-looking statistical models. He also consults the greater Triple-I team on becoming a more data driven institution. Previous experience includes research roles with Mission Measurements, New York University Department of Economics, and Sonoma State University Department of Economics. Riley holds a Bachelor of Arts in Economics, a Bachelor of Science in Statistics and a Bachelor of Arts in Pure Mathematics from Sonoma State University, and a Master of Arts in Economics from New York University, focusing on Quantitative Economics.