Download

A Secret for Comparing Workers' Comp Costs

In trying to compare workers' comp costs with peers, many companies struggle. But they may already possess the answer -- in their own data.

Workers’ compensation claims and medical managers are continually challenged by upper management to analyze their drivers of workers' comp costs. Moreover, upper management wants comparisons of the organization’s results to that of peers. The request is appropriate. Costs of doing business directly affect the competitive performance of the organization. Understanding drivers of workers' comp costs is key to making adjustments to improve performance. Still, it’s not that simple. Executing the analysis is the lesser of the two demands. More challenging is finding industry or peer data that is similar enough to create an apples-to-apples study. In a recent article, Nick Parillo states, “Regardless of the data source, whether it be peer-related or insurance industry-related, risk managers must be focused on aligning the data to their respective company and its operations.” Parillo emphasizes that the data should be meaningful and relevant to the organization. Aligning the data to the situation can be challenging. Industry or peer data may not be situation-specific enough or granular enough to elicit accurate and illuminating information. State regulations vary, as do business products and practices, along with a multitude of other conditions that make truly accurate comparisons difficult. Variability in the data available for benchmarking can be especially disconcerting when considering medical cost drivers, which now account for the majority of claim costs. Differences in state fee schedules and legislation such as required utilization review (UR) and the use of evidence-based guidelines can produce questionable comparative results. Additionally, whether the contributed data is from self-insured or self-administrated entities can skew the results. Other variables that make comparing industry or peer data less valid are unionization, physical distribution of employees, employee age and gender, as well as industry type and local resources available. Potential differences are unlimited. External sources such as local cultural and professional mores, particularly among treating medical providers, can play a significant role in disqualifying data for comparison. For instance, my company’s analysis of client data has uncovered consistent differences in medical practice patterns in one large state. In one geographic sector, referrals to orthopedists with subsequent surgery and higher costs are far more frequent than in another sector of the state for the same type of injury. Parillo continues, “Given the uncertainty and limitations on the kinds of peer group data a risk manager would need to perform a truly “apples to apples” comparison, the most “relevant and meaningful” data may be that which a risk manager already possesses: His own.” Analyzing internal data can be highly productive. First, the conditions of meaningful and relevant are guaranteed, for obvious reasons. The geographical differential across one state was found in one organization’s internal data, which ensures that data variability is not a factor. Analyses can be designed that dissect the data at hand. Follow up to the above example might include looking for other geographic variables in costs, in injury types and in medical practice patterns. Compare physician performance for specific injury types in the same jurisdiction and then look for differences within. To gain this kind of specificity and relevance, drill down for other indicators. Evaluate how costs move. Look at costs at intervals along the course of claims for specific injury types. In this case, utilizing ICD-9s is more informative than the National Council on Compensation Insurance (NCCI) injury descriptors. One client found that injury claims that contained a mental health ICD-9 showed a surge in costs beginning the second year. Now, further analysis can begin to discern earlier indicators of this outcome. In other words, dive further into the data to find leading indicators. Industry data is not likely to contain the detail necessary to evoke subtle mental health information during the course of the claim. Most analysis ignores the subtlety and sequence of diagnoses assigned. Few would uncover the mental health ICD-9 because few bother with ICD-9s at all. Drilling down, analyze claims that fall into this category for prescriptions, legal involvement and other factors that might divulge prophetic signs. It is an investigative trail that relies on finite internal data analysis. Too often people disrespect their own data, thinking it is too poor in quality, therefore of little value. It’s true, much of the data collected over the years is of poorer quality, but it still has value. Begin by cleaning or enhancing the data and removing duplicates. Going forward, management emphasis should be on collecting accurate data. Benchmarking data sourced from the industry may be useful but should not necessarily be considered the most accurate or productive approach. Internal data analysis may be the best opportunity for discovering cost drivers.

Karen Wolfe

Profile picture for user KarenWolfe

Karen Wolfe

Karen Wolfe is founder, president and CEO of MedMetrics. She has been working in software design, development, data management and analysis specifically for the workers' compensation industry for nearly 25 years. Wolfe's background in healthcare, combined with her business and technology acumen, has resulted in unique expertise.

'Core Transformation' May Not Be Enough

Insurers often think core transformation of systems is just a technical exercise; the organization and skills must change, too.

|||
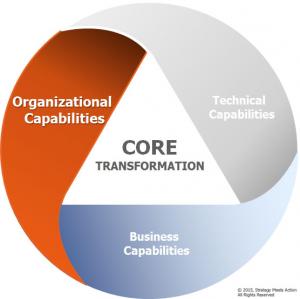
In the 1920s, Hollywood had a pretty good grasp of what it took to be a leading lady. She had to be able to use exaggerated gestures and facial expressions to convey what was going on without the benefit of sound, and she had to look attractive onscreen. Nobody cared what her voice sounded like – and then came the talkies. Suddenly, the established actors and actresses had to learn brand new skills and adapt to a new paradigm, because no movie studio was going to continue putting out silent movies when the other studios were putting out talkies. Some stars did well, like Mary Pickford, a silent film star who won an Oscar for her first speaking role. And then there were actresses like Jean Hagen, playing Lina Lamont in "Singing in the Rain," who sounded like someone stepping on a rubber ducky that had a head cold. Even for the film stars who successfully made the transition, moving from silent movies to talkies was a challenge unlike anything faced before. Every industry encounters these moments, although some are not as obvious as the talkie revolution. The good news is that insurers, as a whole, are starting to execute on their transformation paths. Customer service is improving, business models are morphing, products are becoming more sophisticated and the core systems that support the full breadth of the company’s business are changing – and all these changes continue to accelerate. As I mentioned in our last core blog, SMA’s recent research on policy administration systems found that 94% of insurers require robust configuration capabilities from a new PAS, because these capabilities provide the foundation for the ability to increase speed to market and speed to service, and solution providers have gotten the message. There are more and more systems on the market that are adopting these dynamic configuration capabilities. In fact, they have now become table stakes when core systems are replaced. But there needs to be a transformation of the full core, including people and processes – not simply a system replacement project. The full core transformation includes modern policy, billing and claims systems, advancing business capabilities and an adaptive and agile organization. Among the important ingredients for organizational transformation are the ability to adjust to required new skills, to determine where these skills will be located in the organization and to decide how the delivery of product changes will occur. For example, will you rely on the technology alone to create the differentiation, or will you adjust the organization and the skills? The new configuration capabilities can be used by people who have been trained as business analysts – and these resources are often in short supply at most companies. I have experienced demos where I hear that the configuration capabilities can be used by the business professionals to expedite product deployment. The assumption is that there are resources available in the business to perform this work. In many cases, the reality is that the business does not have the skills, processes or time to perform this work. Often, the technical areas do have the process and some of the necessary resources, but, if the work shifts to the technical side of the business, then the IT pipeline is just being filled with the same volume of change requests that existed in the past. This is the Gordian knot that must be worked through. Insurers that have previously dealt with forms and rating engines have figured this out – they have a handle on reality and how to manage it. Many have reorganized to centralize the resources that will perform these services. They have architects that understand the hazards of configuration and can help create the "bumper guards" that are necessary to ensure success. In SMA’s research note, Policy Administration: P&C Plans and Priorities, 52% of insurers stated that it was difficult to find the right mix of business and technical skills to work on the configuration capabilities provided by modern policy, billing and claims systems. New skill sets are required to fully capitalize on the advantages of responsive and agile product development – new hybrid skill sets that include a combination of business analyst skills and an understanding of technical principles. Some insurers use business analysts. Others turn to IT users who have a strong understanding of business capabilities. In today’s environment, there are not many resources that meet these qualifications. Companies that are investing in training are advancing quickly. A certain flexibility is inevitably needed to cultivate these truly skilled configurators. Insurance companies are organized around yesterday’s capabilities. Insurers need the ability to shift staff between departments – to create new working groups, to manage new priorities, to adapt to new business processes and to engage new skill sets. This flexibility equips an insurer to seize opportunities in the market, establish new modes of customer service and build business models that deliver value-added services that extend well beyond reaction and restoration. The whole point of core transformation is that changes at the micro level can be used as a stimulus for changes at the macro level. Organizations able to address the technical and business capabilities that transformation demands can also make organizational shifts with enormous impacts. The key is to recognize that you must use some creativity and be willing to take some risks by challenging long-established traditions. core There is a happy ending to "Singing in the Rain," and it is not through the solution that Jean Hagen’s studio recommends – that being traditional diction training. Jean finds that what she does best, using her unique voice, leads her down the road to success in the new world of the talkies. In the transformative new world, insurers can also find their own road to success, heading toward the ultimate goal of becoming a Next-Gen Insurer. Core transformation, with its combination of synergistic organizational, business and technical capabilities, is a key ingredient to getting there.

Karen Furtado

Profile picture for user KarenFurtado

Karen Furtado

Karen Furtado, a partner at SMA, is a recognized industry expert in the core systems space. Given her exceptional knowledge of policy administration, rating, billing and claims, insurers seek her unparalleled knowledge in mapping solutions to business requirements and IT needs.

'Age of the Customer' Demands Change

As the music industry shows, the Age of the Customer means that every company must change its focus and embrace the new.

The music industry is in chaos. It’s a dinosaur stuck in the tar of old vinyl. Musicians are no longer knocking on record labels’ doors, asking to get their album out there. Consumers are no longer buying their music from record stores. And, with Taylor Swift withdrawing her entire catalog from Spotify, things get even crazier. The Age of the Customer continues. And if you don’t acknowledge this -- whether in music or in just about every other industry, including insurance -- you could end up loved as much as a set of tangled headphones. You Really Got a Hold on Me In a time not so long ago, musicians had no choice but to go through record labels to even think about reaching their audience. The industry had a three-step process:
  1. Song creation
  2. Marketing
  3. Distribution
This meant artists created their album with the record label’s supervision; the record label then marketed it via in-house or through a third party; the radio stations then played it; and then, finally, customers could buy it at their local record stores. Thus was created a multi-layered model that greatly benefited the record labels. So what happened to this model? They Say You Want a Revolution The Internet happened. By the late ‘90s, when the Internet started to catch fire, people began realizing its potential power, such as the ability to digitalize entire music catalogs. This ultimately led to the birth of music piracy, which drastically cut into record labels’ pockets, creating a rippling effect felt throughout music – within the industry and among music lovers. But when the iPod was introduced in 2001 it shattered the traditional model of the music industry. Musicians could now bypass all the old steps and start putting out their own music through digital sites like iTunes, opposing music piracy and giving royalties back to artists. Then, fans starting getting into the act. As record labels worked to stay relevant, they had to offer artists new partnerships, such as 360° deals. A 360° deal assured artists a share from their music, concerts, merchandising, publishing and licensing income – ultimately creating a five-step model:
  1. Recorded music
  2. Merchandising
  3. Fan sites and ticketing
  4. Broadcast and digital rights management
  5. Sponsorship and management
Any Way You Want It Enter the Age of the Customer. To combat piracy, stream-based cloud services began to emerge (see news on Spotify and Beats Music). Consumers now have the option to listen to any of their favorite songs, on multiple platforms, any time they want – for free even, if you’re willing to put up with commercials. So now consumers can choose to pay to download a song, buy CDs or records, stream their favorite radio stations or stream their favorite music without breaking the law. This, once again, is shattering the music industry’s business model. And, boy, the times they are a-changin'. Consumers now connect globally to their favorite bands through the Internet and bypass exclusive record label channels. The majority of consumers don’t buy albums, they download songs. There’s been a greater attendance at concerts (Live Nation’s ticket sales are up 17%) . Fans seem to be more loyal. Consumers have it made right now, and things seem to be getting even better. Spotify, the online streaming service, started contacting record labels for a possible negotiation. The labels offered a share in their company for a band’s catalog. The big boys started jumping on board, giving listeners gold record bands, such as Led Zeppelin and Pink Floyd – for free. And the record labels are happy, because it’s the first time someone has offered them equity for their band’s music. Which means that, if Spotify goes public, well, it’s more money for them. Everybody wins. However, not everyone is happy with the online streaming service, especially Taylor Swift. After “trying” her music out on Spotify, she decided it wasn’t the best medium for her music, so she pulled her catalog from the streaming service. She also believed her music wasn’t valued as much, because Spotify has no regulations on who gets what – and lack of earned royalties. It’s an interesting situation right now. With artists pulling music from Spotify (even Jason Aldean recently joined the Swift bandwagon), the music industry must ask itself – is online music streaming the future of music mediums? Ch-Ch-Ch-Changes In today’s market, technology has placed the ball back in the consumer’s court. The music industry is reeling and desperately trying to get back in the game, but the game keeps changing. Technology is transforming everything, we all know, but how is your company preparing for the inevitable? Are you creating a customer-centric culture that embraces the new? Or are you waiting to see how your competitors fare?

Donna Peeples

Profile picture for user DonnaPeeples

Donna Peeples

Donna Peeples is chief customer officer at Pypestream, which enables companies to deliver exceptional customer service using real-time mobile chatbot technology. She was previously chief customer experience officer at AIG.

Insurance Opportunity in India Is Knocking

The relaxed limits on foreign direct investment mean massive opportunity in India, which has very little insurance and needs far more.

The newly elected Indian government recently approved a proposal to increase foreign direct investment (FDI) limits in its insurance market to 49%, from 26%, and parliament has approved it. India’s business-friendly Bharatiya Janata Party (BJP) and new Prime Minister Narendra Modi are sending signals that there is opportunity in India. The country is open for business.
Overcoming cultural barriers and convincing foreign capitals to open their economic borders is a struggle that has plagued proponents of economic globalization for decades. The Council has long advocated for opening foreign markets to allow for more competition, to build economies and to drive down prices for consumers. We know countries with open economic borders see healthier competition and cheaper services for their citizens. But isolationism and nationalism are often synonymous, and overcoming these barriers can take years. Rep. Joe Crowley, D-N.Y., vice chairman of the House Democratic Caucus and chair of the Congressional Caucus on India and Indian Americans, for years has championed India relaxing its limits on foreign direct investment. “Raising the cap [is] a win for both the Indian and American economies and our citizens,” he says. “I am hopeful of the new changes being pushed by the new Indian prime minister and urge they be fully implemented. I hope it will come to fruition and expand the partnership between our two great countries.” Victory has a hundred fathers, and this victory has millions. The Indian election in May had the highest voter turnout in the young democracy’s history, with more than 550 million votes cast. The election broke records in terms of dollars spent campaigning, and it included high-tech hologram campaign stints, which might now be in the future for U.S. campaigns. In India’s case, the proposal to increase the FDI caps to 49% had been on the table for six years. Political backlash in the Indian parliament kept the issue from gaining momentum. But this time is different. We would like to say it’s because of the Council’s efforts. We’ve advocated, alongside our global counterparts, for increasing the current cap for insurance intermediaries, and our friends at the World Federation of Insurance Intermediaries have underscored the issue for European FTA negotiators as they work on an economic agreement with India. This work has certainly helped put the issue on the BJP’s agenda, but it was the past election, which swept the BJP to power, that brought it to a head. The BJP’s win over India’s Congress party is akin to the Republican revolution in 1994 in the U.S., when the GOP broke the Democrats’ rule of the House of Representatives for the first time in 40 years. I should note the measure will not be perfect (results of the political process rarely are), but it will be good. Frankly, we would love to see the foreign direct investment limit not just increased but abolished altogether. We also expect the FDI limit to include a stipulation requiring management control of intermediaries and insurers to remain with Indian investors. These are no doubt olive branches to ease the transition. The take-up rate of both commercial and personal insurance coverage in India is significantly low, given the size of its economy. Measured as a percentage of GDP, penetration in the non-life sector was a staggering 0.78% in 2012. Life coverage was slightly higher, at 3.17%. Considering the Indian economy—the 10th-largest by nominal GDP and the third-largest by purchasing power—there’s a ripe opportunity for market penetration. There’s also convincing policy and political need for the coverage to keep the country’s growth sustainable. I’m again reminded of the adage: “Insurance is like oxygen to the economy.” The Council wrote the new government to ensure its understanding of our business and the strengths our industry offers the Indian economy. To underscore our value, Council President Ken Crerar wrote: “Insurance intermediaries are distinctly different from insurance companies and do not pose any systemic risk to the insurance sector as a whole. Intermediaries serve the needs of individual and commercial insurance consumers, helping the purchasers of insurance navigate markets that can be extremely complex, particularly for consumers of commercial insurance products. “Intermediaries not only assist with the purchase of insurance, but also assist consumers with maintenance and claims processes, offering consumers an array of expertise and proficiency in the global market. I would like to highlight the following points as you review the merits of increasing FDI limits:
  • Insurance brokers work for the policyholders and help in risk management, maintaining market efficiencies and protecting consumers.
  • Increasing the exchange of market intellect and expertise on risk management and process efficiency between different countries (and markets) will benefit Indian consumers.
  • Most countries across the globe allow 100% foreign direct investment in the insurance intermediary market, strengthening local markets and keeping costs down.
  • Strengthening the Indian intermediary market will also encourage international reinsurance to the domestic market, as it eases the exchange of risk and insurance products between countries and markets. This further helps consumers as it increases competition and drives costs down.”
Our message didn’t fall on deaf ears this time. Arun Jaitley, India’s new finance minister, told the upper house of parliament that Indian insurers need help maintaining a healthy capital base so they can offer a wider range of products, protect consumer interests against insolvency and deepen insurance penetration in India. “The insurance sector is investment-starved,” Jaitley said. “Several segments need an expansion.” Jaitley predicts India’s private insurance industry needs an estimated $6 billion (Rs360 billion) of additional capital over the next five years. I’m optimistic India's borders are opening, further increasing its international opportunity and economic strength.

Joel Kopperud

Profile picture for user JoelKopperud

Joel Kopperud

Joel Kopperud is the Council of Insurance Agents & Brokers’ vice president of government affairs. He focuses on legislative and regulatory activity affecting employer-provided benefits, property/casualty insurance regulation and federal natural catastrophe policies. He is a regular contributor to Leader’s Edge magazine.

How to Spot and Avoid Your Next Crisis

Monitoring certain behaviors, both individual and corporate, can let you know that a crisis may be looming -- in time to prevent it.

Q: Can I identify my organization’s next crisis? If so, how?

A: Jim Satterfield- Undoubtedly, yes. Knowing what the next crisis might be is a way to think about planning and information. There are warning signs and indicators when we discuss human behavior. Understanding behaviors of concern and identifying them earlier in the process is imperative. It provides an idea of the frequency and severity of a situation.

If we can see those indicators, if we can identify those behaviors, then we can intervene before they become a problem. Sometimes, they are business or financial indicators; sometimes, it’s just human behavior.

On 9/11, I was EVP and chief operating officer of a public technology firm with employees in the States and around the world. When the first plane hit the first tower, we thought it could have been an accident. When the second plane hit the second tower, clearly not an accident. We called a meeting in our boardroom and, while sitting around the table, decided it was a day unlike any that we’ve ever seen.

Our management team decided it would be better to let everybody go home. I turned to our HR director and said, “Could you send a global email out to everybody in the company telling them they could just go home”? She went back to her desk, and she typed this message: “If you want to live, leave.”

The intended message was to be: “If you want to leave, leave.” Those are two entirely different messages. “If you want to live, leave.” “If you want to leave, leave.”

Thinking about your messages when you’re not under stress is very, very critical, and planning makes a difference.

Q: I already have a detailed and updated copy of our organization’s crisis plan. Do I need to have a digital copy, as well?

A: Jim Satterfield- Unless you’re planning to add a psychic on your crisis management team, it’s not going to do you any good to have an outdated or out-of-reach plan. Keeping your plans current and available is crucial. If you can’t get access to the right information at the right time, it’s not going to do you any good. “Oh, the plan’s back in the office, and I’m at home.”

Speed is quality. Getting the right answers to the right people at the right time becomes a critical element in every crisis.

Q: What should my organization’s key messages be to each stakeholder group for vulnerabilities and threats?

A: Jim Satterfield- What we’re going to say internally will be different than what we’ll say externally. Think about who your stakeholders are. If you’re in a business that’s heavily regulated, you have regulators as a stakeholder group. You have employees and investors, as well. If a school, you have parents, students and possibly church affiliation. You have various elements to be dealt with, and that makes a difference in approach.

Q: What resource can help with quick decision-making?

A: Jim Satterfield- What you do is list in one column things that could happen, things that could damage:

  • The facility
  • The employees
  • The data
  • The brand
  • The reputation

Across two more columns, we indicate what would qualify as a minor event and what is considered a crisis. You then include descriptive terms and circulate it to the entire company.

Immediately, when something comes up, refer to the matrix. If an employee is injured, but did not receive emergency treatment, it remains a minor event. If the employee had to have some medical attention, it rises to the next level. If an employee dies, that’s crisis. It’s at the highest level that management would want to be involved, so creating an event activation matrix is the fastest way to get that quick response with everyone on the same page at the same time.

Q: What are common mistakes people have made during a crisis?

A: Jim Satterfield- These are the five failures that we see over and over and over again in a disaster or crisis:

  • Failure to control critical supply chains
  • Failure to train employees for both work and home
  • Failure to identify and monitor all threats and risks
  • Failure to conduct exercises and update plan
  • Failure to develop crisis communications plans
  • About 70% of employees don’t know what they’re supposed to do in a disaster or a crisis. In addition, 95% don’t have a disaster plan at home. If something happens in your area, and you think your family is at risk, family wins. That’s why people don’t show up in a crisis, because they’re concerned about their family.

    We work on these failures through our Predict/Plan/Perform process. First, identify groups. Then conduct exercises and establish how you’re going to monitor and communicate. When you think about your individual plans, think about them in light of these groups. You need to build preparation in from all of these groups that could ultimately be a problem within the organization.

    Q: Are school students classified under workplace violence?

    A: Jim Satterfield- Yes, because it’s a workplace. The school is a workplace, yes.

    Q: Prevention is rare in organizations that have small staffs. Have you found organizations are willing to assign staff to conduct social media monitoring on their time?

    A: Jim Satterfield- They can, or you can use an outside service that will do it for you. This route is much more cost-effective. Why? Because that’s the specialist’s full-time job.

    Whatever your full-time job is, you’re good at that job. If you only do something every now and then, you’re not going to be as good, and you may miss an important signal or piece of information.

    We are finding organizations -- both large and small -- are conducting monitoring as a preventative measure, and we conduct such intelligence gathering for a number of clients.


    Jim Satterfield

    Profile picture for user JimSatterfield

    Jim Satterfield

    Jim Satterfield, president and COO of Firestorm Solutions, LLC, is a nationally recognized expert on crisis management, threat assessment, disaster preparedness and business continuity planning. He has extensive public and private company experience in the identification of problems and designing solutions.

    How 'Cascades' Can Build Work Culture

    Though they are too seldom a focus, "cascading effects" can either be measured and used to enhance work culture or can debilitate it.

    |||||

    Most of us have heard the phrase: "Culture eats strategy for breakfast." It could be restated as, "Your actions speak louder than your words." This means that management can dream up any strategy they want, but their behaviors and actions are what create the culture of an organization.

    Culture drives how efficient an organization's processes are. Culture drives the success or failure of an organization. Culture is the product of leadership decisions or the lack of decisions.

    The best-articulated corporate vision and strategy are of no value if they cannot engage the hearts, minds and work habits of employees at all levels and convey a purpose beyond just profit.

    A vision states where an organization wants to go; a strategy defines the path to get there; and the work culture describes how business processes are actually executed along the path toward the vision. The health of a work culture can range from a contagiously high-performance work culture to mediocre or all the way down to a disruptive, confrontational culture that can't get much done on time or done right the first time. A disruptive culture can trump the best vision and strategies every time. On the other hand, if a work culture is nurtured and groomed to align with a carefully crafted vision and strategy, the positive momentum could be unstoppable.

    Figure 1 shows possible scenarios of vision, strategy, culture and performance alignment and misalignment. Business process performance (small white arrows) is more correlated with the work culture (small red arrows) than with the vision or strategy (big blue arrow) of an organization. Work culture -- not vision or strategy -- culture drives business performance. The challenge presented by this dilemma is that the work culture is an invisible force that is hard to measure. It shows its good side when you watch it and only displays its bad sides when you look away. The work culture is the product of complex cascade effects inside an organization and is as much affected by leadership actions as it is by the lack of appropriate actions. If left unattended, it will create its own random world of hidden agendas, which will probably not be aligned with the priorities of the organization.
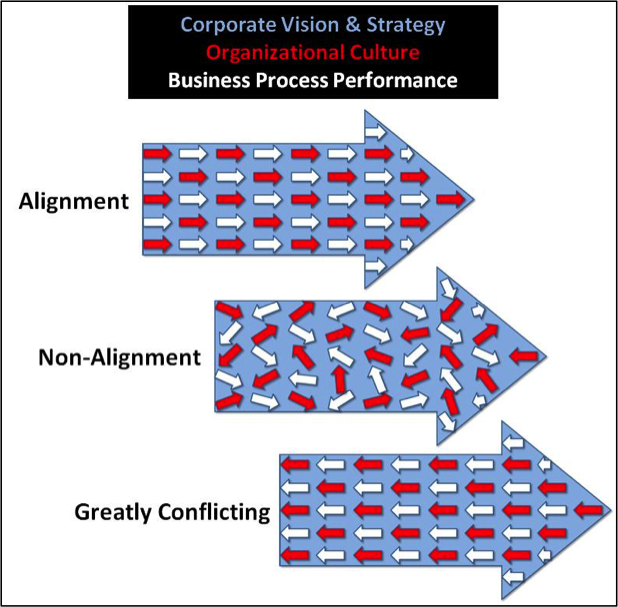
    Untitled Figure 1 - 3 Possible scenarios of vision, strategy, culture and performance alignment

    Corporate visions and strategies are usually rolled out in formal three- to five-year plans. Work culture management and monitoring is too often not in sync with that plan and referred as an “HR thing," even though it is the gate-keeper of business performance. If you do not understand and actively manage the work culture, it will manage you.

    Measuring Cascade Effects Risks

    It would be wonderful if we could just plug a measurement device into an organization to check its health and the risks of cascade effects (Figure 2). The work culture defines how employees work with each other through communication, coordination and cooperation. It generates multiple slow-motion and rapid chain reactions, ripple effects and cascade effects that greatly affect the mood and attitude of the organization. It predestines an organization for success or failure.
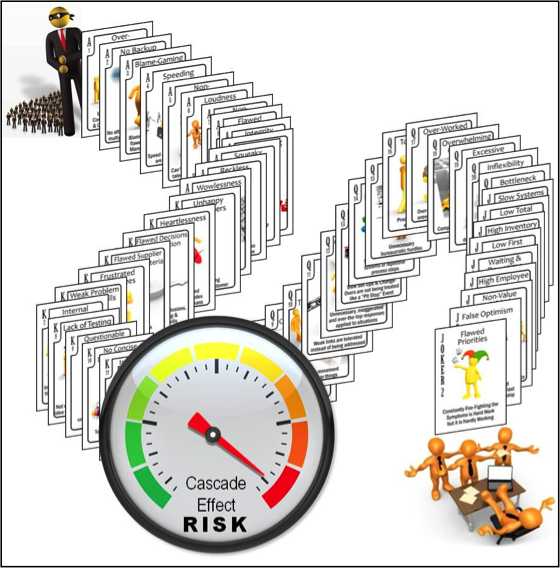
    Untitled Figure 2 - The challenge of measuring work culture health and risks

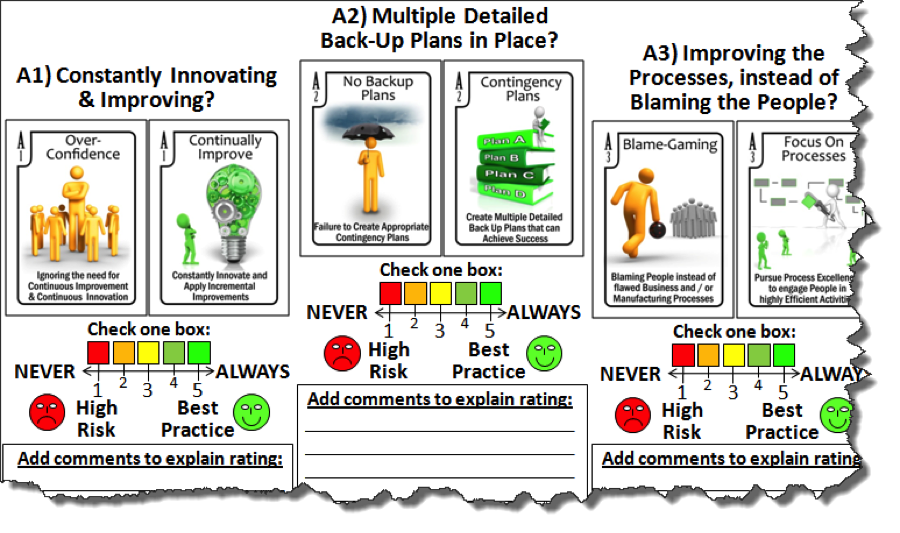
    How can we measure the health of invisible cultural chain reactions that can drive the success, mediocrity or failure of an entire corporation? I suggest a series of management and employee surveys and brainstorming assessments to test for the presence of 56 different elements of risk that can be present at any level in an organization. (See Figure 3 for a partial view of the survey.) The culture assessment tool shown in Figure 3 should be used for at least three different levels of management in an organization. These three levels of perception will offer triangulation data points, which will show how common or diverse the perceptions are that describe the organizational culture.
    Untitled

    Figure 3 - Partial view of a gamified organizational health survey

    The Organizational Force-Fields That Drive Success or Failure

    Chain reactions, domino effects, ripple effects and snowball effects are similar in that they are defined by the single acts that created them. Once triggered, they will play out their effects depending on the amount of resistance the system presents against them. Cascade effects are different. They are fueled by a hierarchy of multiple interacting triggers at different levels in the system.  Time delays between cause and effect are common, making the direct correlations between cause and effect more difficult to identify. Each element of the cascade effect can create dramatic outputs involving as many as three degrees of separation, rippling through an organization. There are three types of organizational cascade effects:

    • Destructive tsunamis of non-cooperation and negativity
    • Expanding groups of  status quo herd followers
    • Constructive waves of cooperation, empowerment, motivation and positivity

    If all of the cascade effects are present in an organization at the same time, the result will be conflict, employee frustration and lack of momentum in the right direction.  A random mix containing equal parts of motivated, frustrated, positive and cynical employees co-located for 40 hours a week is not a formula for success; it is a recipe for mediocrity or even disaster.

    Positive Organizational Cascades

    These are acts of positivity that multiply and can also spread from person to person. In 2010, researchers from the University of California, San Diego and Harvard published the results from their experiments in an article titled: "Cooperative behavior cascades in human social networks." They showed that cooperative behavior can be just as contagious as bad behavior. They showed that positivity can spread from person to person to person by displaying random acts of cooperation, generosity and other positive behaviors. This creates a cascade of cooperation that influences dozens of people who were not involved in the initial trigger event.

    Mediocrity and Consensus Cascades

    These cascades are the result of contagious personal decisions to blend in with the crowd and not make any waves (also known as "group think"). Many researchers, including those from the computer science department at Carnegie Mellon University, have confirmed this phenomenon. Forces in organizations and society like peer pressure, blending in, the herd mentality and the band-wagon effect can cause an individual to follow the herd, even if that violates personal preferences and value systems of what is right and what is wrong. This is often done to save one’s reputation in a group and gain acceptance. Efforts to achieve team consensus can create the same phenomena, resulting in conclusions that might not always be the best ones. Teams can assign a "devil's advocate" role to a participant to deliberately challenge "herd decisions" to counter this cascade effect.

    In 2013, Forbes wrote an article titled: "Brainstorming is Dead…," which summarized recent criticism by many about how creative people can get suppressed by other personalities during brainstorming events when the main priority is to get consensus on all brainstorming conclusions. Forcing consensus is as useful as it is dangerous. To avoid ineffective and dangerous group-think cascade effects, group decisions should build on each other's ideas, when possible, to create innovative hybrid solutions and not pick one idea and totally discount another idea that might have a flicker of genius.

    Negative Organizational Cascades

    These are acts of negativity that multiply and spread from person to person in an organization. Risky, combative and uncooperative behaviors all have the unfortunate ability to multiply and spread to three degrees of separation from the original act. This can have a negative impact on dozens and even hundreds of downstream people not involved in the initial negative triggering acts. Negative human interactions can break the bonds of humanity and teamwork. These cascades can destroy the work culture, effectiveness and performance of an entire organization.

    The Broad Influence of Cascades

    Behavioral researchers have demonstrated with team experiments that positive, mediocrity and negative cascades can all have affect three degrees of separation (friends of friends of friends). Other researchers and computer models have determined that only three to four degrees of separation is what separates everyone in the USA, and only six degrees of separation separate everyone in the world. Exceptions to this rule are the secluded tribes in the Amazon jungle and other remote places. Yes, the world is smaller than we think, and actions really do speak much louder than words. Actions and behaviors can reach beyond the horizon and into different time zones.

    The Organizational Forces Survey

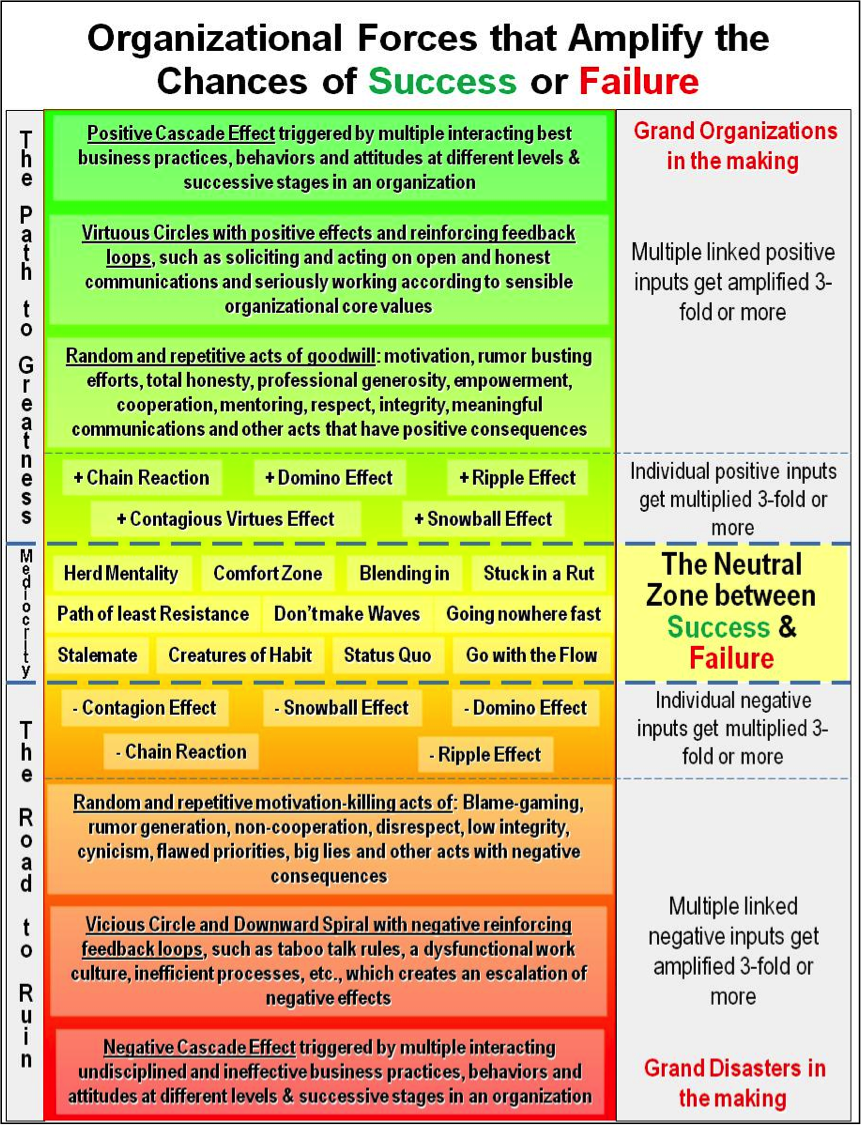
    The Organizational Forces Survey tests the health of the individual organizational forces that drive chain reactions, cascades and other behavior propagation phenomena. This survey asks participants to assess the presence of positive and negative organizational forces shown in Figure 4 by identifying the forces they believe to be present. This survey is given to all levels of employees and management.
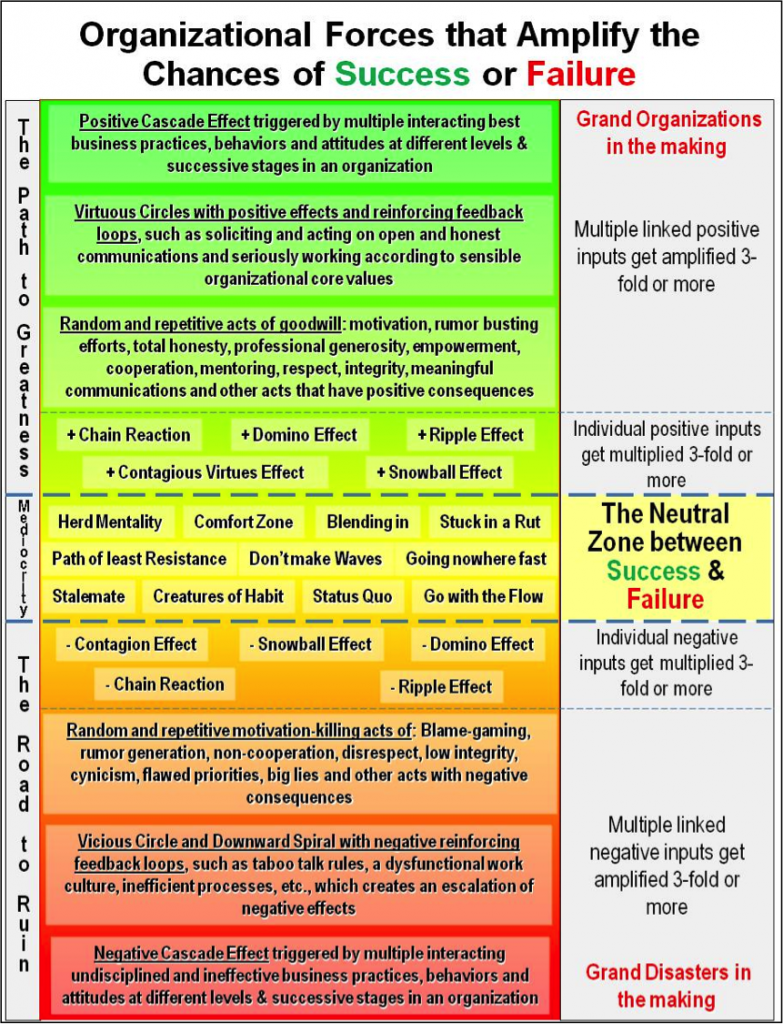
    Untitled Figure 4 - The Organizational Forces Survey used to assess the health of the work culture.

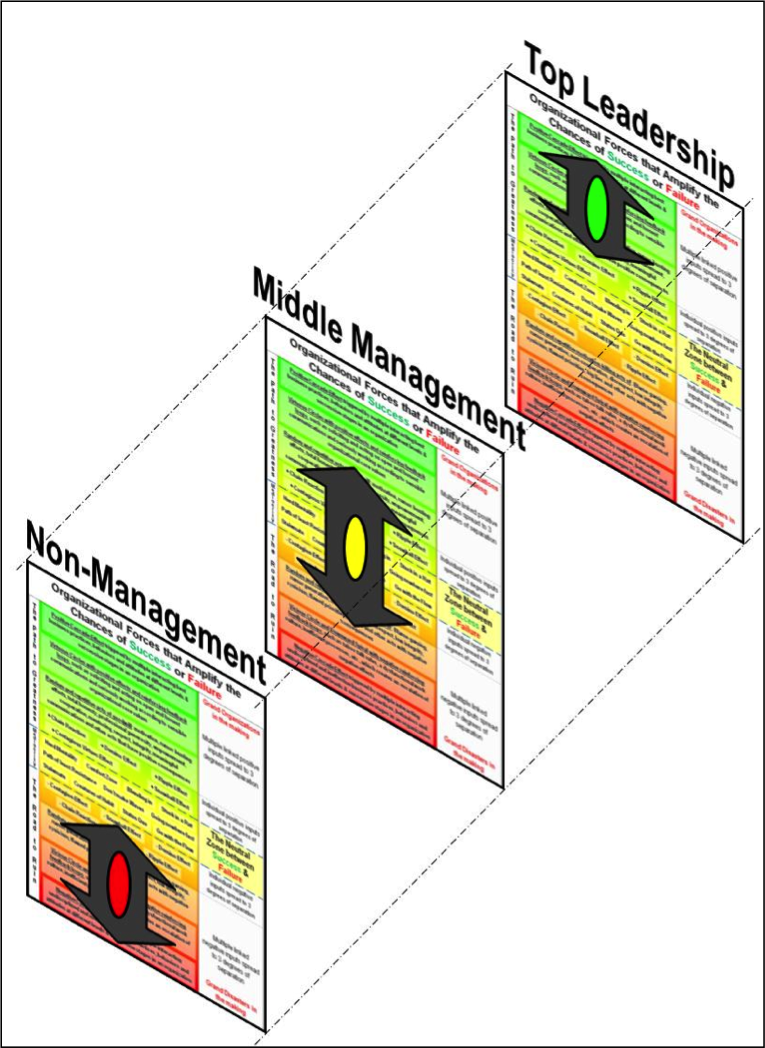
    Figure 5 shows an example of survey responses, using the form in Figure 4, that were attained from the survey for three different levels in an organization: top leadership, middle management and non-management. One sign of healthy communications between management and employees is when organizational risk assessments are similar between different levels in the organization. However, that is not the case here.

    In this survey response example, top leadership rated the health of the work culture as overwhelmingly positive (green). They perceived their environment to be a Grand Organization in the making. Unfortunately, non-management employee responses to this survey were at the opposite end of the scale (red). They rated the forces in the organization as overwhelmingly negative, filled with high risk and knocking on the door of a Grand Disaster. Middle management rated the work culture as mediocre (yellow), with some responses slightly positive and others slightly negative. This group of employees was apparently influenced by perceptions of top leadership and non-management.
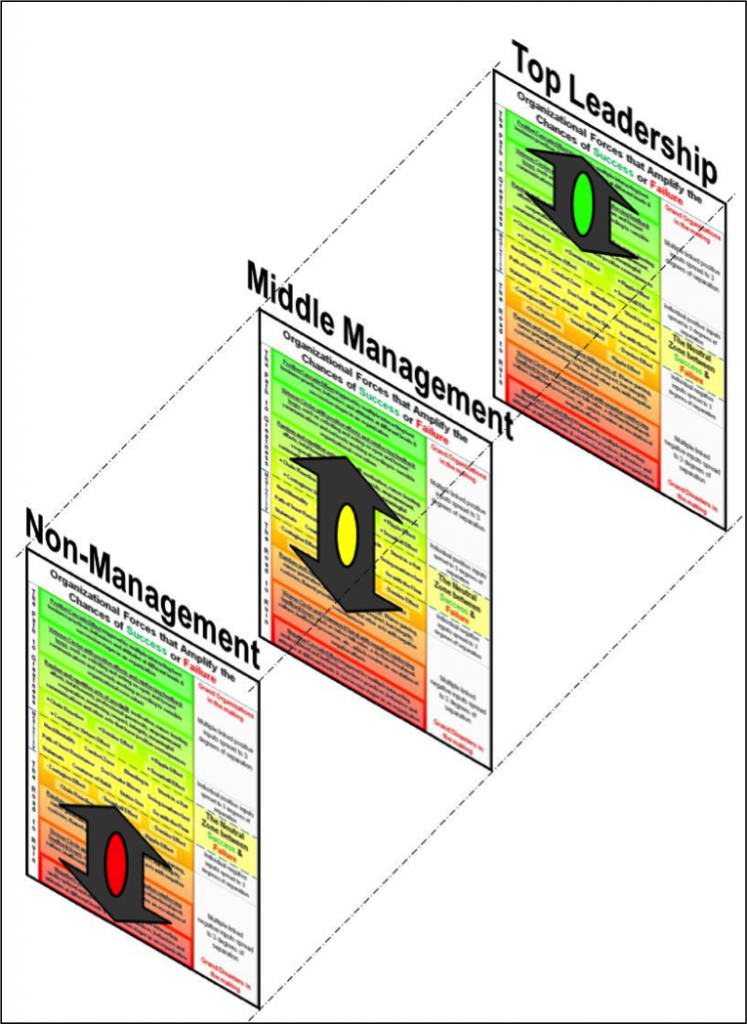
    Untitled Figure 5 - The range of survey responses from various levels in this organization shows major discrepancies in their perception of the health for the organizational work culture.

    Conclusion

    Grand investigations are often done after a loss of life disaster occurs, such as a NASA space shuttle disaster, a passenger airplane crash or an accidental employee death on the job. However, it is hard to find this level of effort and analysis applied to prevent such disasters. Deep and thorough disaster investigations often find flawed undisciplined leadership practices and organizational cultures at the root of the problems. It is also common to discover a zealous ambition to grow the business without really ensuring that a healthy work culture foundation is put in place to safely support such expansion.

    Huge opportunities for organizational productivity improvements still exist today by cultivating a high-performance work culture. Breakthroughs can be made when organizations appreciate the fact that  “culture eats strategy for breakfast,” a phrase coined by Peter Drucker, a famous management consultant, educator and author. True organizational greatness can be achieved when organizations look beyond trying to just manage the bottom line and learn how to manage, analyze and monitor the cultural forces and cascade effects that drive success or failure.

    A grand vision and strategy can only revolutionize a company when the work culture is healthy, engaged and aligned with those concepts. Taboos on talk must be broken. Open, frequent and candid communications must exist between all levels in the organization. Employee issues and concerns must be addressed in a timely manner as proof that a functioning communication and countermeasure system are in place. Only then can an organization really have a chance to break its barriers to greatness.


    David Patrishkoff

    Profile picture for user davidpatrishkoff

    David Patrishkoff

    David Patrishkoff is president of E3 (Extreme Enterprise Efficiency) and the founder of the Institute for Cascade Effect Research. He is a Lean Six Sigma Master Black Belt and the inventor of a cascading risk management methodology that has patent pending status.

    Move Workers' Comp Out of the Silo

    Workers' comp has historically been in one silo, with health programs in another. Smart companies are combining the efforts.

    Over the last three-plus decades, employers have grappled with dramatic increases in healthcare and workers’ compensation costs, according to the Centers for Medicare and Medicaid Services. Workers’ compensation costs climbed more than 40% just in the last five years in California, according to the Oregon Workers’ Compensation Premium Rate Ranking Summary. At the same time, the lost time and productivity associated with injuries and illnesses add to the urgency to find a new approach to managing these costs.

    Wellness programs that support and encourage employee health are popular, deployed today in more than 60% of companies with three or more employees, according to Kaiser Family Foundation and Health Research and Educational Trust research. While some believe that the benefits of wellness programs are overstated, all of the recent attention on wellness and the costs of healthcare and workers’ compensation warrants a new look at the bigger picture.

    Employee health and its associated costs continue to be managed in a silo — separate from, and somehow unrelated to, workers’ compensation and "lost time" programs. Yet, these initiatives are related, and smart companies should be integrating data around workers’ comp, healthcare and productivity, to identify ways to support employees, thereby reducing costs, increasing productivity and ultimately resulting in a healthier workforce.

    Breaking Down the Silos

    In many organizations, group health plans and workers’ compensation programs are managed separately, often with finance responsible for workers’ compensation and HR managing the health plan. Because of the occupational/non-occupational nature of the claims — and the two distinct systems for their management — this historic division made sense when overall healthcare costs were a small component of organizational spending.

    However, research is finding that viewing these programs — along with their corresponding components, such as safety, wellness, disability and leave management — as competing concerns in separate silos is short-sighted and counterproductive.

    For example, based on recent research by Kaiser, we now know that smokers in the workforce are 40% more likely, and obese workers twice as likely, to have a work injury than non-smokers or leaner counterparts. Other corresponding data demonstrate similar links — obese workers who have a work injury generate seven times greater medical costs and spend 13 times more time away from work.

    Organizing in traditional silos can create a hidden incentive to shift cost and risk to another internal program (“that injury happened on the job, didn’t it?”) rather than working together to reduce or eliminate the costs for the benefit of the company as a whole. Viewing these issues in a vacuum masks the true nature of healthcare costs, as is easily seen when data is analyzed in an integrated fashion. The traditional silos prevent organizations from (a) realizing improved productivity and the profit it brings and (b) maximizing the potential of internal efforts such as safety or wellness programs.

    Taking an Integrated Approach

    Kaiser Permanente has studied this approach and offers some startling numbers. Figures provided by the Workers’ Compensation Insurance Ratings Bureau of California (WCIRB) show the losses per indemnity claim nearly doubling since 1998, to a total of nearly $90 billion. The holistic view provided by new data enables Kaiser to look at employee health, workers’ compensation and workplace safety through a broader population health management lens.

    Other insurance companies are starting to roll out programs that look at synergistic and more holistic opportunities for employee health to drive down costs, improve productivity, boost the bottom line and help employees enjoy better health. These programs help companies understand the total cost of health and safety by looking at the employee benefits and workers’ compensation costs, as well as absenteeism and "presenteeism" (an employee who is physically present at work but unproductive because of health problems or personal issues). These programs look at lost productivity, as well as identifying the specific risk factors that are driving up costs. By determining what can be modified, and creating specific action plans, employers are able to realize lower health costs, fewer on-the-job injuries and faster recoveries.

    Let’s use smoking as an example. In addition to increased workers’ comp costs, numerous government and academic studies tell us that:

    • Smokers lose an average of 6.0 workdays per year — almost double the absenteeism of non-smokers;
    • Smoking exacerbates the effect of chronic disease on productivity;
    • Smokers are less likely to exercise and more likely to be heavier drinkers;
    • Smokers are estimated to spend between eight and 30 minutes a day in unsanctioned smoking breaks. This equates conservatively to more than 33 hours per year of lost time, just because of unsanctioned smoking breaks. At 15 minutes per day, the total lost productivity rises to 62.5 hours annually;
    • Lower direct healthcare and lost-time costs equal improved profit, as does greater employee productivity and morale. Combining these efforts strengthens efficiencies and drives greater profit improvement.

    While the concept and math are simple, changing deeply entrenched organization models, long-standing procedures and practices and the outmoded personal attitudes and behavior they encourage and reinforce is challenging. But it can and should be done. By finding the right consulting partner, companies can tear down the silos and look at the world through a broader lens of integrated, holistic safety, health and wellness. Everyone — the organization, its people and the stakeholders — will win.


    John Connell

    Profile picture for user JohnConnell

    John Connell

    John Connell is responsible for the leadership and overall growth and success of EPIC’s employee benefits consulting operations across the Western U.S. Before joining EPIC, Connell spent 26 years in consulting, management and leadership positions with Jenkins Insurance and Leavitt Group.

    Wellness War Is Over; Wellness Lost

    Actually, proponents surrendered in the wellness war, producing a report that debunks their own claims of return on investment.

    |||
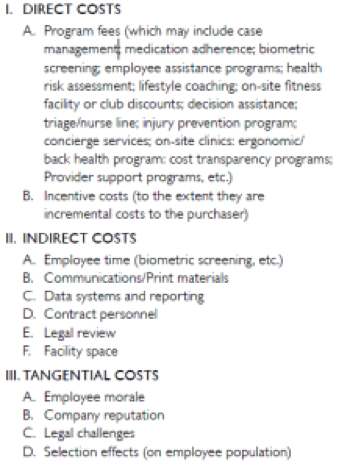
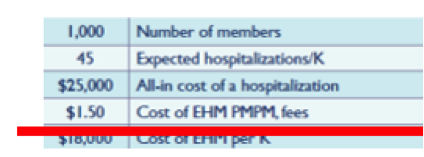
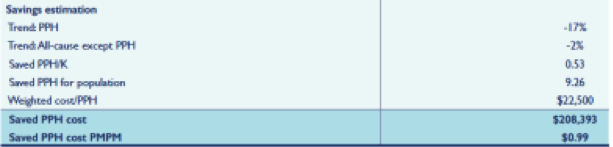
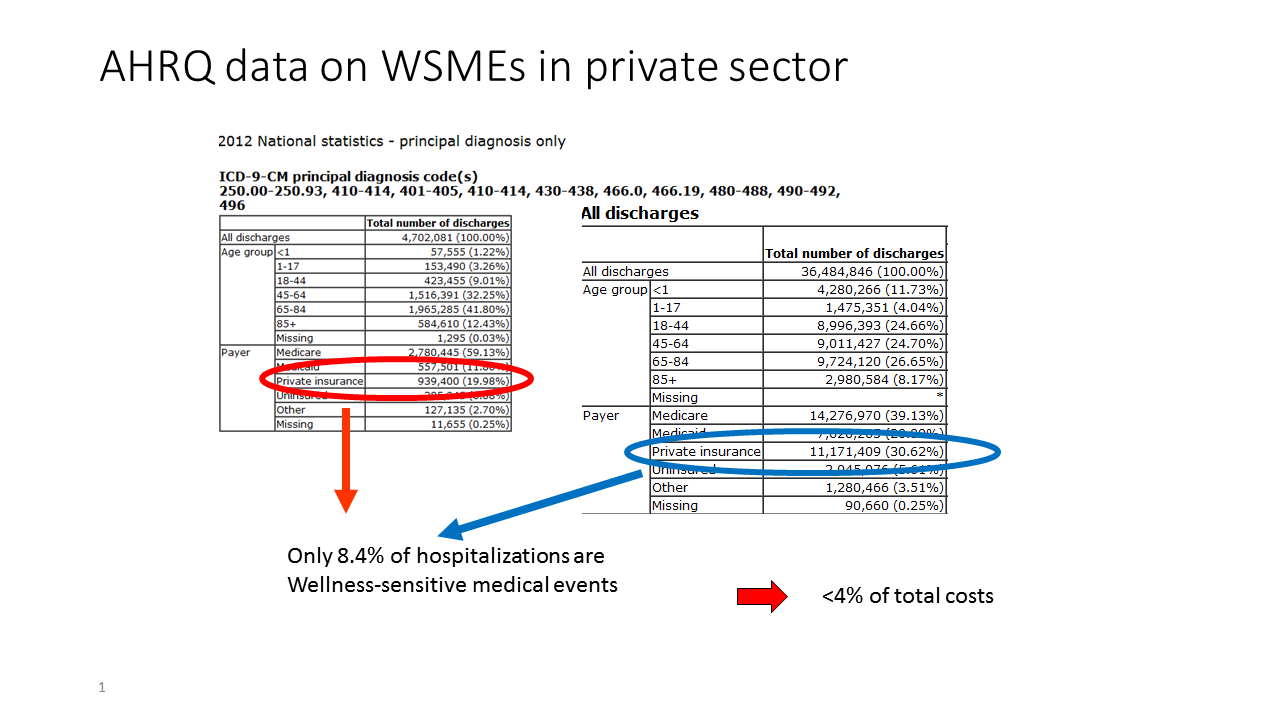
    What if we told you that “pry, poke, prod and punish” wellness programs are bad for morale, damage corporate reputations and cost more money than they save? You’d say: “Al, you, Tom Emerick and more recently Vik Khanna have been telling us that for years.” You might add: “And while your opinions are usually well-reasoned and based on good data, we’d have to hear the true believers’ side of the story.” But what if we told you: “That is the true believers’ side of the story”? Yep, the wellness industry’s leading luminaries – 39 of them, representing 27 vendors and one consulting firm (Mercer) -- have all gotten together under the aegis of both their trade associations – Health Enhancement Research Organization (HERO) and Population Health Alliance (PHA) -- and reached that “consensus.” We don’t know if they simply didn’t read their own report before reaching this consensus, or whether they just all decided to tell the truth. Frankly, we’re fine either way. (This is also the second time in five months that a major wellness true believer admitted wellness doesn’t save money. The first time was a meta-analysis in the American Journal of Health Promotion that concluded that “randomized clinical trials show a negative ROI.” After we started quoting the analysis, the editor wrote a 2,000-word essay walking it back.) Because our claim that we are laying out “the true believers’ side of the story” would otherwise require a certain suspension of disbelief, we are going to rely more heavily than usual on screenshots. We also recommend reading the report itself, or at a minimum our analyses of it. (Our analyses are going to be a 10-part cycle. Make sure to “follow” the website They Said What? to not miss a single episode.) Page 10 of the report lists 12 elements of cost. The first element itself contains about 12 elements, making this a list of 23 elements of cost. (Add consulting fees, which were overlooked even though three Mercer consultants sat on the committee and even though page 14 calls for use of “consulting expertise,” and you get 24.) You’ll see damage to employee morale and corporate reputations listed as “tangential costs.” But, as two people who run a company, we would call damage to those intangibles much more than tangential. Our company runs on morale. Pulling people away from their workstations to poke them with needles, weigh them, measure their waists and test to see if they are lying about their smoking habits couldn’t possibly be good for morale. We are equally curious about the blithe dismissal of legal challenges as a tangential cost. No firm wants its name dragged across the wire services because it is being sued for its wellness program (just ask CVS and Honeywell). Getting dragged into the courts (and, hence, the media) for running a wellness program isn’t a tangential cost -- and it’s an unforced error. Untitled On Page 15, as the report discusses how to measure the return on investment, the authors select only one of those 24 costs – vendor fees – as the basis for comparison. Omitting the other 23 costs, plus incentives, makes it easier to show an ROI. The fees are listed as “$1.50 per employee per month,” or $18 a year, even though the rule of thumb is that wellness programs cost many hundreds of dollars per employee per year. Untitled Further in, on page 23, the authors list the related savings: $0.99 per “potentially preventable hospitalization,” abbreviated as PPH. (The fact that we have to do the math on our own by comparing figures across pages suggests this admission of losses was a gaffe rather than deliberate honesty.) Untitled The savings figures are based on reductions in event rates that (1) are about twice what typically gets achieved; and (2) somehow overlook the natural decline of 3% to 5% a year in cardiac events even without a wellness program. Even without adjusting for those two mistakes, savings fall $0.51 PMPM short of vendors fees alone. And losing $0.51 per employee per month is the best-case scenario. The “savings” includes benefits from disease management (which is not covered by the $1.50 PMPM in vendors fees), and omits the offsetting costs of all the extra doctor visits that come from overdiagnosis and overtreatment. So, here are the two conclusions:
    • According to proponents' own consensus, wellness loses money.
    • Even worse, their savings are wildly overstated (yes, according to government data), and their costs, by their own admission on page 10, are wildly understated.
    Don’t take our word for either of these. Write to us, and we will send you an ROI spreadsheet that you can use to do your own calculations. One way or the other, what RAND’s Soeren Mattke called the wellness wars are over. Wellness has surrendered. How Will the Wellness Industry Respond? HERO and its assembled luminaries will probably ignore this gaffe, to prevent a news cycle that their customers might notice. However, if the problem gets covered broadly, they will respond. This was their modus operandi the last time they got “outed.” We had shown them in 2011 that one of their key slides, for which they even gave themselves an award, was made up. We presented our proof many times and even put it in both our books…but it wasn’t until Health Affairs shined a bright light on it that they acknowledged wrongdoing. They said that the slide “was unfortunately mislabeled” by an as-yet-unidentified culprit, but that no one noticed for four years. (Rather than relabeling the slide in a "more fortunate” way, they took the slide off the site.) To clarify that their position is indefensible, we have offered a reward of $1 milliion for them to simply convince a panel of Harvard mathematicians that they have any idea what they are talking about beyond the fact of the gaffe itself.  Their refusal to claim this reward speaks volumes. Implications for Brokers The implications for brokers are profound. First, stop placing wellness programs -- or at a minimum get a “release” from your clients saying that they’ve read this article but want to proceed anyway. The disclosure by the wellness industry’s own trade association that wellness loses money increases your liability because you “knew or should have known” that losses were to be expected. Second, you can probably offer your client the chance to abrogate vendor contracts, especially if the vendor was one of the 27 that reached this “consensus.” That might reduce your revenue in the short term but will cement your relationship. And you want your clients to find out about wellness' problems from you, not from the media. But whatever else you do, follow future installments here on Insurance Thought Leadership as we plow through this report and deconstruct more of not just their crowd-sourced math but also of their crowd-sourced alternative to reality, in which prying into employees’ personal lives, poking them with needles in blatant disregard for government guidelines, prodding them to get worthless checkups and punishing them when they don’t is all somehow going to save employers millions of dollars.

    Has U.S. Economy Slowed to a Standstill?

    A new Fed model for the U.S. economy shows almost no growth for the first quarter -- raising some fundamental questions for policy.

    ||
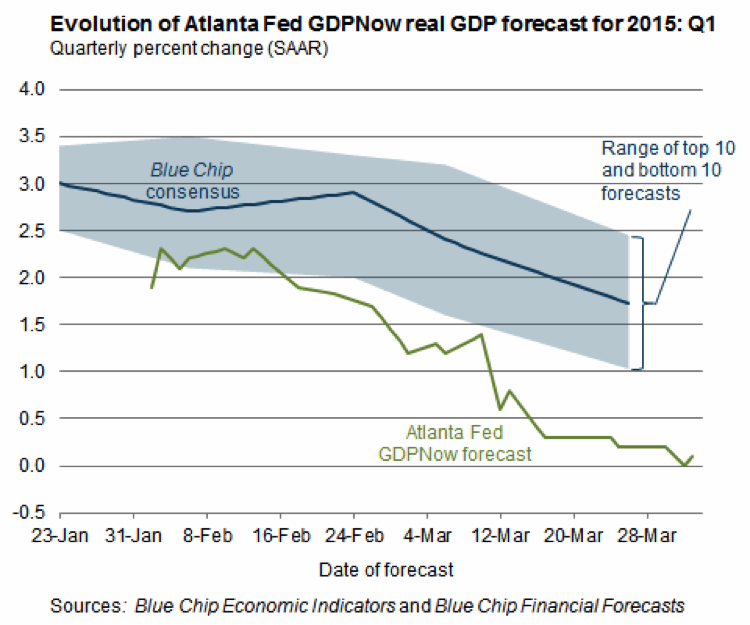
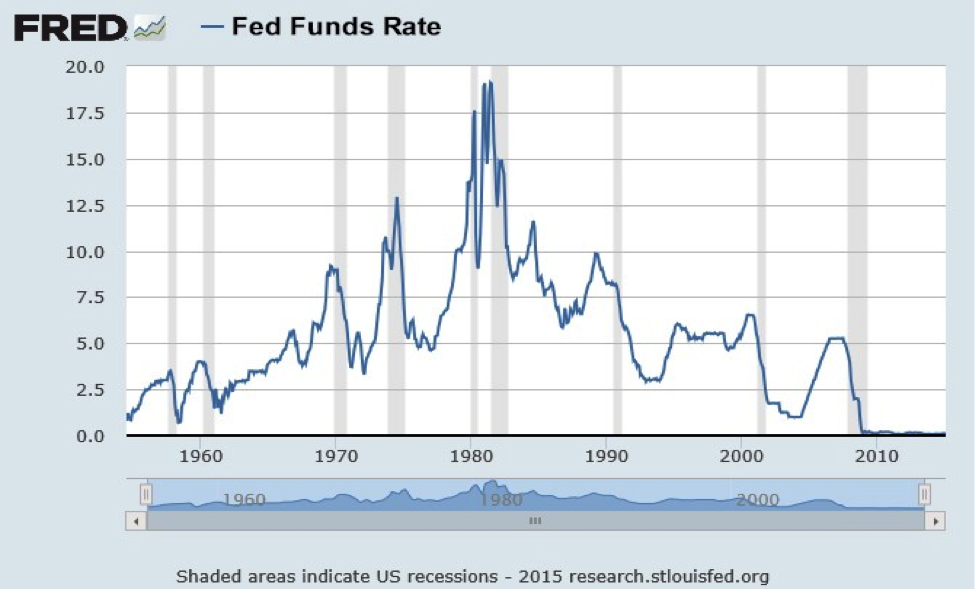
    Increasingly, we live in a world of now. Instantaneous access to digital real-time data and news has simply become a given. You may be surprised to know that the Federal Reserve has taken notice. To this point, GDP data from the U.S. Bureau of Economic Analysis (BEA) has arrived after the fact. From the perspective of a financial market and investors that are always looking ahead, GDP data is “yesterday’s news.” Moreover, revisions to GDP can come to us months or even years later, essentially becoming an afterthought for decision making. Recently, though, the Atlanta Federal Reserve has developed what it terms a GDPNow model. It essentially mimics the methodology used by the BEA to estimate inflation-adjusted, or real, growth in the U.S. economy. The GDPNow forecast is constructed by aggregating statistical model forecasts of the 13 components that compose the BEA’s GDP calculation. Private forecasters of GDP, such as the Blue Chip Consensus, use similar approaches. Their forecasts are usually updated monthly or quarterly, but many are not publicly available, and many do not specifically forecast the components of GDP. The Atlanta Fed GDPNow model circumvents these shortcomings, forming a relatively precise estimate of what the BEA will announce for the previous quarter’s GDP. The model is still young, but it is beginning to be discovered more widely among the analytical community. The reason we highlight this new tool is that we’ve incorporated it into our continuing, top-down review of the U.S. economy. More important to our “here and now” thinking is the current reading of this new model. As you can see in the next chart, the forecast by the Atlanta Fed for Q1 2015 U.S. real GDP growth is 0.1%, up from 0% at the end of March. As is also clear from the chart, as of the end of the March, Blue Chip economists were collectively predicting 1.7% growth -- quite a difference. Untitled Chart Source: Atlanta Federal Reserve Why the drop in the Atlanta Fed real-time forecast for Q1 2015 real GDP? As we look at the underlying numbers in the model, we see recent weakness in personal consumption. Many had predicted an increase in consumption with lower gasoline prices, but that has not played out, at least not yet. Weakness in residential and non-residential construction has also played a part in the downward revision. Weather on the East Coast has not been kind to builders as of late, but that’s a seasonal issue easily overcome by sunshine. Importantly, slowing in U.S. exports and equipment orders meaningfully influenced the March drop in the Atlanta Fed model. We know global currencies have been weak; the highlight over the last six months has been the euro. With a lower euro, European exports have actually picked up as of late, and the message is clear: The strong dollar is beginning to hurt U.S. exports. We do not see this changing soon. (As you know, the importance of relative global currency movements has been a highlight of our discussions over the past half year.) Finally, durable goods orders (orders for business equipment) have been soft as of late because of slowing in the domestic energy industry. Again, that is a trend that is not about to change in the quarters ahead given dampened global energy prices. Like any model, the Atlanta Fed GDPNow model is an estimate. Whether Q1 U.S. real GDP comes in near zero growth remains to be seen, but the message is clear, there is downward pressure on U.S. economic growth. This pressure is set against a backdrop of already documented slowing in the non-U.S. global economy. Perhaps most germane to what lies ahead for investors in 2015 is what the U.S. Fed will do in terms of raising interest rates -- or not, if indeed the slowing that the Atlanta Fed model predicts materializes. We believe this slowing will become a real dilemma for the Fed this year and a potential issue for investors. The Fed has been backed into quite the proverbial corner. Whether the U.S. economy is slowing, the Fed is going to need to start raising interest rates for one very important reason. It just so happens that the end of the second quarter of 2015 will mark an anniversary of sorts. It will be six years since the current economic expansion in the U.S. began. As of July, ours will be tied for the fourth-longest U.S. economic expansion on record (since the Fed began keeping official track in 1945). There have been 11 economic expansions over this period, so this is no minor feat. The second quarter of this year will also mark the 6 1/2-year point for the U.S. economy operating under the Federal Reserve’s zero interest rate policy. You’ll remember that, during the darker days of late 2008 and early 2009, the Fed introduced 0% interest rates as an emergency monetary measure. That was deemed acceptable as crisis policy. Given that the FED has maintained that policy, it is essentially saying that the current economic cycle has not only been one of the lengthiest on record, but simultaneously is the longest U.S. economic crisis on record. As we look ahead, the “crisis” in the eyes of the Fed will come to an end as it contemplates higher short-term interest rates. Although it still remains to be seen what the Fed will decide and when, there is one very important consideration that must be entering their interest-rate-policy decision making at this point in the economic cycle -- a consideration they will never speak of publicly. Let’s start with a look at the history of the federal funds rate (the shortest maturity interest rate the Fed directly controls). Alongside the historical rhythm of the funds rate are official U.S. recession periods in the shaded blue bars.   Untitled Chart Source: St. Louis Federal Reserve There is one striking and completely consistent behavior: The Fed has lowered the federal funds rate in every recession since at least 1954. There are no exceptions. You can see the punchline coming, can’t you? Just how does one lower interest rates from zero to stimulate a potential slowdown in the economy? Of course, in the European banking system and in the European bond market (government and corporate paper), we are witnessing negative yields. Capital is essentially so concerned over principal safety, it is willing to pay to be invested in a perceived safe balance sheet. Will we witness the same phenomenon in the U.S.? A move to negative interest rates in the U.S. would further punish pension funds, which are not only starved for return but are still underfunded despite fantastic returns for financial assets over the past five years -- and Baby Boomers have been rapidly moving into their retirement/pension collection years. Without venturing into negative-interest-rate territory, the Fed is essentially out of interest rate bullets in its monetary policy arsenal. It’s out of the very ammunition it has employed in each and every recession of the prior six decades. If the U.S. were to enter a recession, the Fed would be unable to act on the interest-rate front, as it has for generations. Is the U.S. teetering on recession? Not as far as we can see, despite the Atlanta Fed GDPNow model's reading of very close to 0% growth. We need to remember that U.S. GDP growth has been below average in the current cycle and that the cycle is not young. But the time to contemplate questions such as we are posing is well before a recessionary event. If the Fed is going to raise interest rates, it should be while the economy is still growing. Although the Fed will never speak of this publicly, it cannot be trapped at the zero bound (0% interest rates) when the next U.S. recession ultimately arrives. The proverbial clock of history is ticking just a bit louder as we enter the second quarter of 2015. Is this, perhaps, the key reason the Fed will need to at least begin raising interest rates this year regardless of the near-term tone to the economy?

    Brian Pretti

    Profile picture for user BrianPretti

    Brian Pretti

    Brian Pretti is a partner and chief investment officer at Capital Planning Advisors. He has been an investment management professional for more than three decades. He served as senior vice president and chief investment officer for Mechanics Bank Wealth Management, where he was instrumental in growing assets under management from $150 million to more than $1.4 billion.

    Cloud Apps Routinely Expose Sensitive Data

    An astounding number of employees are still uploading highly sensitive data to the cloud and sharing files on unsecured platforms.

    An alarming number of cloud-based apps used by enterprise employees don’t encrypt data at rest or require two-factor authentication. And an astounding number of employees are still uploading highly sensitive data to the cloud and sharing files on unsecured platforms, according to the Cloud Adoption Risk Report Q4 2014 from cloud security vendor Skyhigh Networks. Security & Privacy News Roundup: Stay abreast of key developments on cybersecurity and online privacy topics The recent breach of 80 million records at health insurer Anthem was an example of how cloud services that don’t encrypt data leave personal records exposed to savvy cybercriminals. The Q4 report was based on usage data from 15 million employees at 350 companies worldwide. It found that the average company used 897 cloud services in the fourth quarter of 2014, up from 626 the year before. Data at Risk While the number of cloud providers that have invested in key security features more than doubled last year, still only 11% encrypt “data at rest” -- inactive files stored in data bases. Only 17% have multifactor authentication. “In light of the recent breaches, that’s alarming,” says Kamal Shah, Skyhigh's vice president of products and marketing. “The Anthem breach is a great example of how, if you’re not careful, cloud services can be used to exfiltrate data out of the organization,” he says. More than a third of users uploaded at least one file with sensitive information to a file-sharing cloud service, Skyhigh found. Some of that information included customer Social Security numbers (SSN), date of birth, credit card or bank account numbers and personal health records. Skyhigh also found that 22% of files uploaded to cloud-based file sharing apps had sensitive or confidential information. At the same time, 11% of documents were shared outside the enterprise, and 18% through third-party email services like Gmail, Yahoo and Hotmail, which don’t encrypt data at rest. File-Sharing Exposure The growing trend in file sharing is driven by the limitations of email, Shah says. Besides having size constraints as files get larger, email is a static environment. “File-sharing is much more active -- a living, breathing space,” he says. Less surprising in the study was the number of compromised identities -- especially given the record number of breaches and vulnerabilities in 2014. Skyhigh found that 92% of companies have compromised credentials, with 12% of users affected, on average, at each company. “A lot of people use the same passwords for their work life as they do for their personal life, and when they’re compromised, those credentials can be used to steal corporate data,” Shah says. The trends driving the rapid cloud adoption are driven by legitimate business needs, Shah notes. Which means the old way of doing business -- by simply restricting app usage -- no longer works for IT managers. “Shadow IT is not bad because employees are using these cloud services for the right reasons,” he says. “The old way of blocking services is no longer effective.” What that means for IT administrators is the need to educate their employees about the risks of apps that are not enterprise-ready, he says. (Skyhigh’s definition of enterprise-ready includes cloud services that rank one to three on a scale to 10 based on attributes like encryption, two-factor authentication, legal condition of service and so on.) Despite all the breaches, the use of cloud adoption will continue to accelerate rapidly, Shah says. “For enterprises, there’s urgency to take action before it’s too late,” he says. “If you don’t act now, the problem will get bigger and bigger.” This article was written for ThirdCertainty by Rodika Tollefson.

    Byron Acohido

    Profile picture for user byronacohido

    Byron Acohido

    Byron Acohido is a business journalist who has been writing about cybersecurity and privacy since 2004, and currently blogs at LastWatchdog.com.