A contractor’s most important resource, and one of its leading costs, is its employees. By investing in employee, supervisory and leadership development programs, those in construction and facilities management (CFMs) can expect positive ROI and other measurable outcomes in both risk management and human capital. This strategy combines organizational development practices to leverage human capital risk management and protect a company’s bottom line.
What Is Human Capital Risk Management?
Defined as leveraging human resource assets to achieve an organization’s strategic and operational goals, human capital risk management implies the following realities for CFMs to consider:
- Human capital is a tangible asset
- Human capital yields tangible and intangible results
- Human capital can generate a positive or negative rate of return
- Human capital risk management can create a sustainable competitive advantage
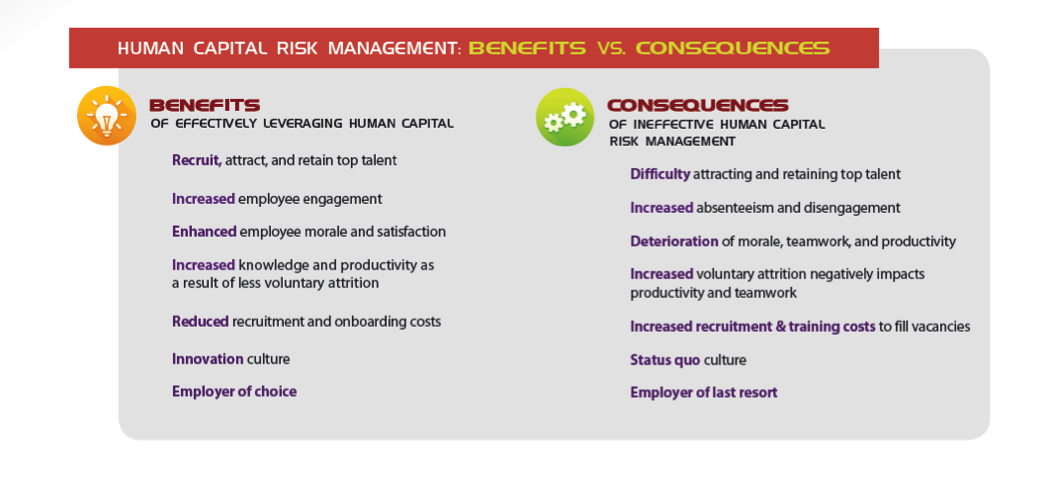
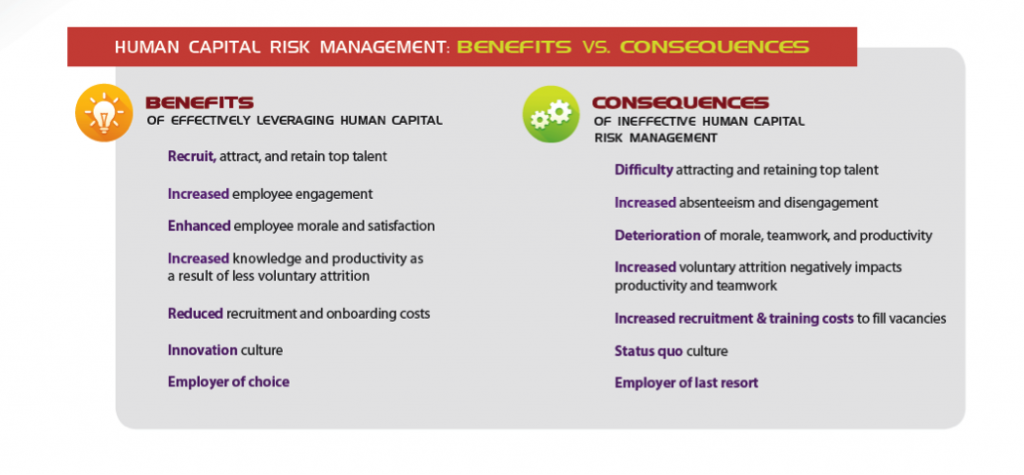
Benefits & Consequences
There are numerous benefits of leveraging human capital risk management strategies. Likewise, there are serious consequences for failing to effectively manage human capital risk management strategies.
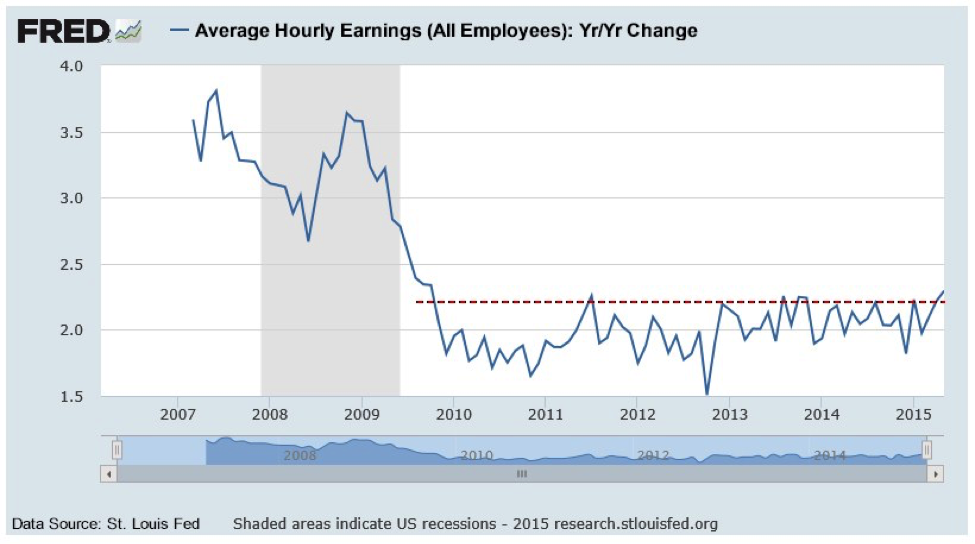
The categories of human capital costs include salaries, health and retirement benefits, workers’ comp and other required insurance costs (e.g., state and federal unemployment taxes). Other possible human capital costs stem from losses attributable to consequences from unsuccessful human capital risk management practices, including: fraud and internal theft; absenteeism; substance abuse; and costs of incidents, accidents and injuries that include workers’ comp losses and resulting third-party liabilities. These costs can be affected by the type of contractor, where the contractor (or project) is located, whether the contractor is union or merit shop and other variables.
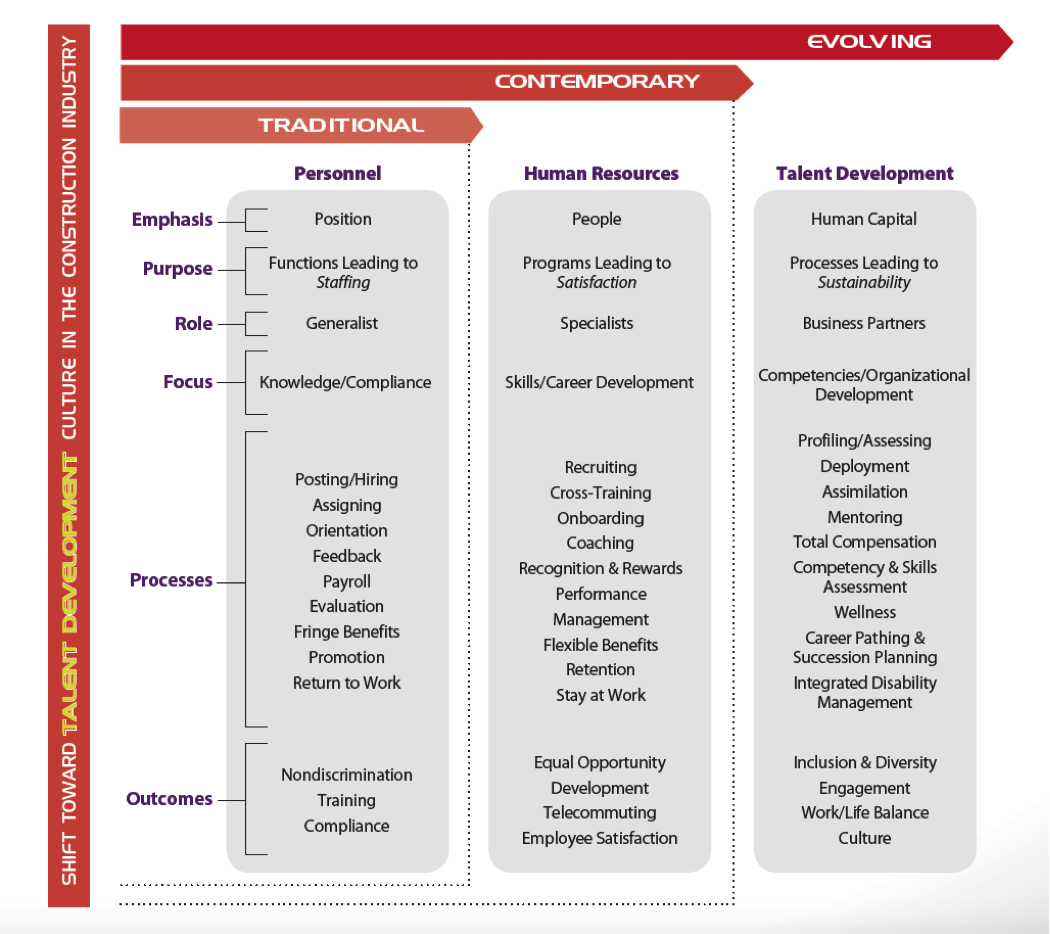
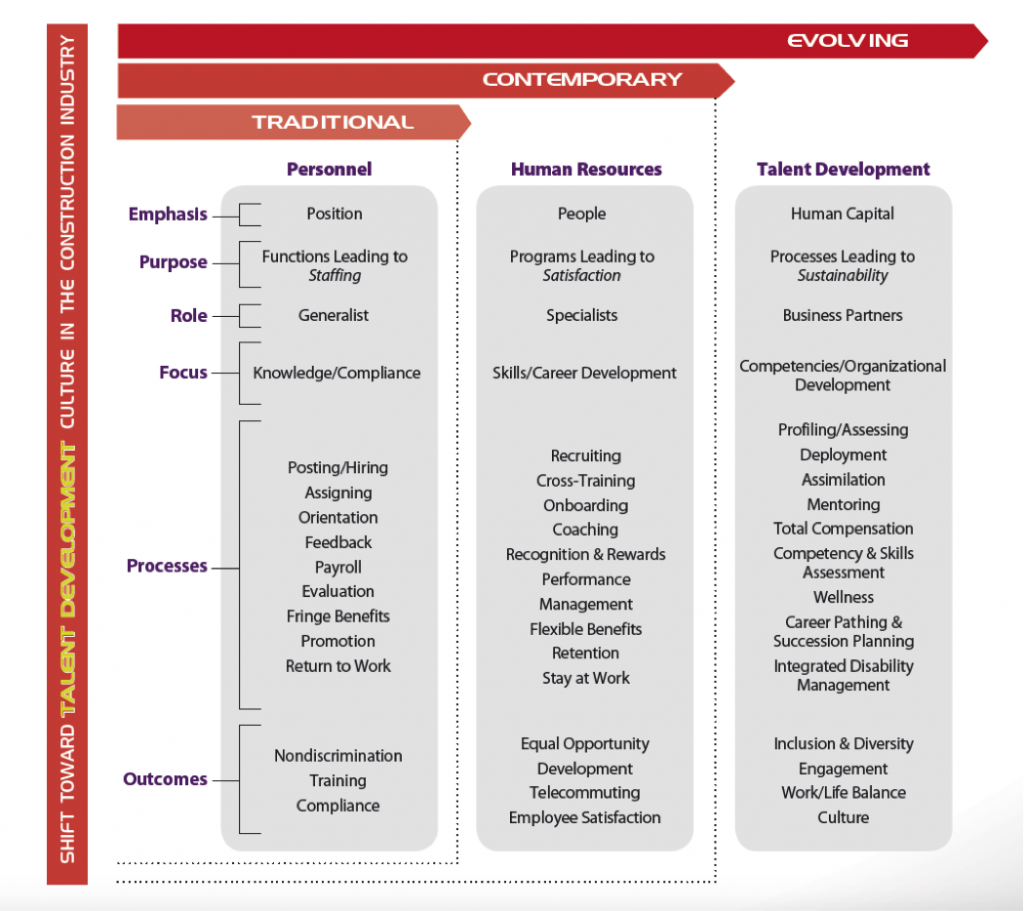
 The Shift from HR to Talent Management
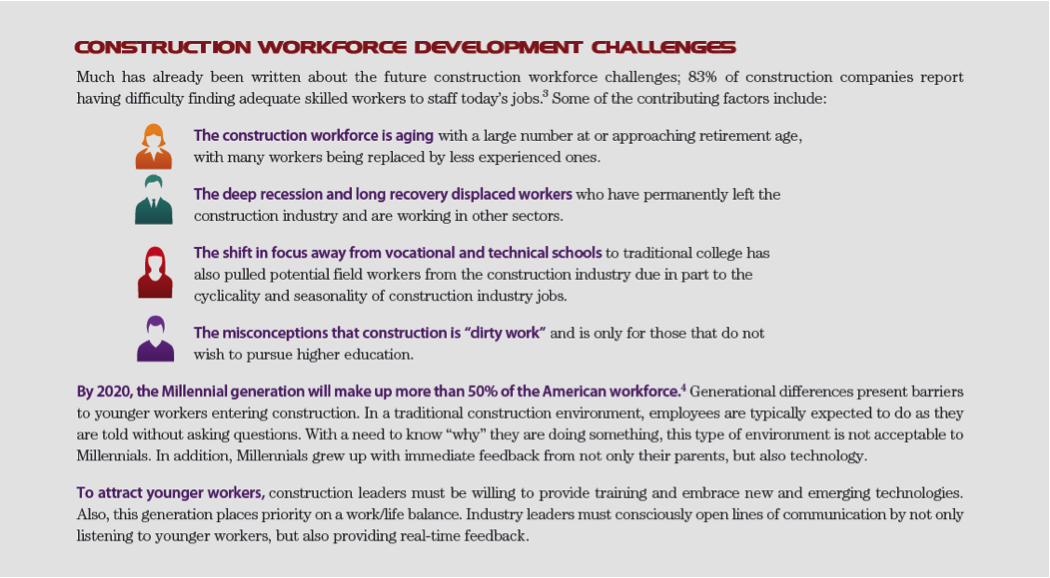
Two talent pipeline concerns are prevalent in the industry: the looming mass exodus of Baby Boomers from the
construction workforce, and concerns about how to engage Millennials long enough to develop their skills and prepare them for future leadership roles.
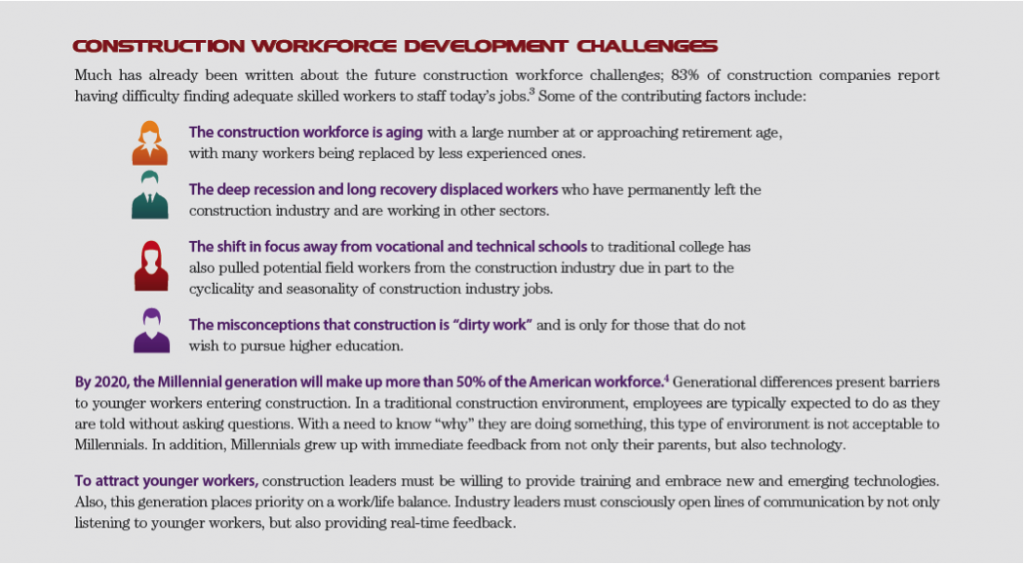
Today, senior business leaders are looking to the HR function to provide innovative solutions to attract, retain and grow their talent. The evolution of HR to a talent management model focuses on processes leading to organizational development. As a result, the modern HR department is responsible for seven fundamental functions:
1) Compliance – Ensure regulatory and legal compliance
2) Recruitment – Find a work force
3) Employee Relations – Manage a work force
4) Retention – Maintain a work force
5) Engagement – Build an engaged work force
6) Talent Development – Create a high-performing work force
7) Strategic Leadership – Plan for a future work force
Investing in human capital makes good business sense, especially considering the costs to recruit, onboard and train a new employee. Not only is employment advertising and recruiting costly, but there are also other adverse impacts to the business. Work previously being done by the exiting employee still needs to be completed, so it falls to teammates and the supervisor.
A new employee typically does not reach full productivity until at least four to six months into her new role. In total, the lost productivity costs to turn over one employee is at least six months.
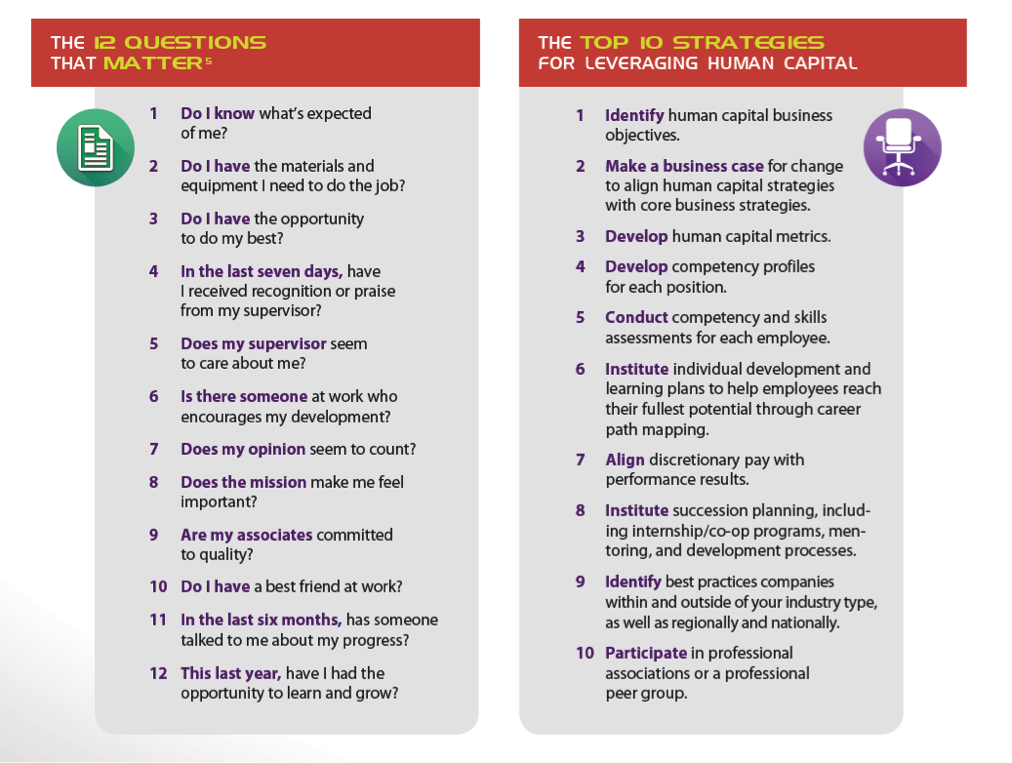
The Link Between Employee Engagement & Business Performance
Engaged employees want both themselves and the company to succeed. However, companies often only focus on employee satisfaction, which can lead to complacency and a sense of entitlement. Employee engagement is frequently defined as the discretionary effort put forth by employees – going above and beyond to make a difference in their work. Discretionary effort is the extra effort employees want to give because of the emotional commitment they have to their organization.
Unlocking employee potential to drive high performance results in business success. However, according to research by the Employee Engagement Group, 70% of all employees from all industries are disengaged. Employees with lower engagement are four times more likely to leave their jobs than highly engaged employees. And disengaged managers are three times more likely to have disengaged employees.
Research shows employees become more engaged when business leaders are trusted, care about their employees and demonstrate competence. By working to engage their employees, contractors can improve their productivity, innovation and customer service. They can reduce incident rates and decrease voluntary attrition.
One of the earliest links between employee satisfaction and business performance appeared in
First, Break All the Rules: What the World’s Greatest Managers Do Differently, which includes a cross-industry study that demonstrated a clear link among four business performance outcomes: productivity, profitability, employee retention and customer satisfaction.
The organizations that ranked in the top quartile of that exercise reported these performance outcomes associated with increased employee engagement:
- 50% more likely to have lower turnover
- 56% more likely to have higher-than-average customer loyalty
- 38% more likely to have above-average productivity
- 27% more likely to report higher profitability
Recognizing and acting on the correlation between engaged employees and business performance will directly affect the bottom line. Some strategies employers can implement to increase employee engagement include:
- Focus on purpose and values vs. policies and procedures, which has led companies to outperform their competitors by six times.
- Encourage empowerment and innovation, then reinforce and reward the right behaviors.
- Unleash the flow of information and ensure individuals have a clear understanding of how their particular job contributes to the company’s strategy and mission.
- Understand and demonstrate that work/life balance is important.
Developing Sustainable Leadership & Human Capital Strategies
Many organizations are hyperfocused on implementing training programs and processes. However, training should not be the only activity. Effective human capital management demands forward thinking and strategic planning about how contractors can engage their human resources to make a difference in driving the business forward into the future.
A spectrum of sustainable employee, supervisory and human capital and leadership development strategies includes orienting/onboarding, performance reviews and developmental plans, coaching/mentoring, job rotation and cross-training, 360-degree feedback surveys, defining career paths, work/life balance and competency assessment.
Research & Connect With Peers
Developing a sustainable human capital development program can seem overwhelming, but that does not need to be the case. Reach out and connect with peers and subject matter experts to identify and share best practices and challenges. There are many resources available that can be tailored or adapted to meet your business needs.
Define & Align Sustainable Long-Term Human Capital Strategies
It is essential to not only align human capital strategies with core business strategies but to also continually review them to ensure long-term sustainability and to address areas for development and improvement. Connecting these areas of focus will ensure a consistent vision is communicated and executed throughout the organization.
To gain a better understanding of your company’s human capital strategic thinking and planning, conduct a needs assessment or gap analysis. Based on the results, a human capital action plan can be developed to help guide your company’s future human capital leadership and investment.
Integrate Human Capital Strategies With Organizational Culture
All human capital strategies should closely align with a company’s intended organizational culture. The strategies may require a shift in culture, but not so much that it creates implementation barriers. Having a formal rollout and communication plan developed in advance will help prepare employees for the coming change.
A variety of communication approaches helps to reach all intended stakeholders and should include what, why and expected outcomes. To ensure all employees “hear” the message, communicate strategies that outline a clear plan and are easy to follow through creative visual and auditory media. Examples include interactive meetings to communicate coming changes, postcards with graphics that present the message, e-mails that are fun and positive, conference calls so people can participate regardless of location, as well as podcasts, webinars, Skype, etc.
Implement Talent Review & Succession Planning
To create a culture of learning and development, contractors should include all employees in their talent development practices rather than focus only on preconceived “high potentials.” Through an effective talent review process, managers can determine the potential future and developmental needs of all employees.
Effective talent review discussions will unveil high-potential employees, which will help populate employee development
and succession plans. True high potentials should be given stretch goals to be accomplished throughout the year to aid in assessing and developing their readiness for future roles.
Everyone Is a Leader
At the end of the day, it is not realistic to expect companies to provide the same training to all employees. However, it is important to remember that everyone is a leader in what they do. Setting these expectations better prepares employees for future leadership roles and helps to build accountability across the company.
Importantly, not all leadership competencies and behaviors will apply to every position. However, by consistently applying higher performance expectations across the organization, employees who were not previously considered high-potentials might begin to excel and even surpass previously identified potential levels. You never know when a new rock star employee will emerge!
Case Study: Lakeside Industries’ Annual Leadership Conference
Lakeside Industries, Issaquah, WA, is a third-generation family-owned business operating for more than 60 years. A producer of hot mix asphalt and paving contractor with 20 locations in Washington, Oregon and Idaho, Lakeside Industries has a total of 625 employees and is signatory to various locals of three labor unions: Laborers, Operating Engineers and Teamsters.
The vision of the company’s third-generation President Michael Lee is to “attain exceptional performance in everything we do.” In this case, “exceptional” has been further defined as aspiring to attain “world-class” performance. He says:
"Several years ago, we realized the need to invest in its leaders. We know that effective leaders translate to improved quality, employee engagement, better communication, fewer incidents, higher production, etc. Each of our 12 divisions operates as an individual entity with its own crews, shops, plants, and fleets. Geography and diversity produce challenges related to training.
"We started with two groups. Managers and PMs were in one group, and superintendents were in the other. Each group met once a year locally to share ideas, procedures and challenges.
"We also used this time to conduct leadership training. Sometimes instruction was internal, and sometimes we brought in external experts. While this was a great start, we knew we needed more consistency communicating company objectives, ethics and expectations. Many of our foremen never had any formal leadership training.
"So, for the past few years, we’ve had one annual meeting that includes every employee in a leadership position. Managers, PMs, superintendents, foremen and anyone who supervises another employee is invited; about 175 people attend annually. To remove distractions, we hold the three-day meeting in Denver, CO.
"Each year we decide which company goals are our top priorities. We bring in a speaker to communicate those goals and to motivate and train our leaders.
"A very popular component is the breakout sessions. All PMs and superintendents meet in groups, as do paving foremen, project superintendents, traffic control supervisors and so on. There are usually 10-12 breakout groups that are conducted by a facilitator in a roundtable format to address issues specific to their positions. We have also conducted breakout sessions by division. It’s an opportunity for division leaders to communicate outside of their daily busy environments and set goals for the coming year. We ensure training is interactive and effective. There is also time for relationship building with recreational activities.
"An important component of this concept is follow-up. It’s essential to repeat and reinforce what was learned when we return home to our busy routines. HR and risk management/safety work with division managers to integrate learned concepts into daily operations. Key learning points are communicated to all of our employees.
"Our vision is for the entire company – from divisional and departmental managers to field staff – to understand and implement our goals and expectations. We want all employees on the same ship, sailing in the same direction, and we work on this all year.
"We started with the goal of training effective leaders, but we’ve unexpectedly achieved so much more. There is improved communication among peer groups including:
- we have innovation, new lines of communication, collaboration and lasting relationships;
- our leaders are now united and understand the company’s vision; and
- our leaders make better decisions and communicate more effectively, resulting in more engaged employees, improved quality, and what we call safe production.
"The bottom line: This leadership conference is absolutely worth the investment."
Conclusion
As the construction labor market tightens because of demographic, societal and industry shifts, finding and keeping skilled workers will become increasingly challenging. Progressive workforce development strategies can differentiate contractors as employers of choice.
CFMs who think strategically recognize that employee, supervisory and leadership development programs, processes and practices can provide a competitive advantage. Investments in human capital yield tangible and intangible gains that improve productivity, quality, risk, safety and financial performance. This should neither be unexpected nor surprising: after all, people are our greatest asset.
This article was co-written by Tana Blair and Tammy Vibbert. Tana Blair is responsible for organizational and leadership development at Lakeside Industries in Issaquah, WA. S he can be reached attana.blair@lakesideindustries.com. Tammy Vibbert is the director of human resources at Lakeside Industries in Issaquah, WA. She can be reached at tammy.vibbert@lakesideindustries.com.
Copyright © 2015 by the Construction Financial Management Association. All rights reserved. This article first appeared in CFMA Building Profits. Reprinted with permission.