
The cybersecurity insurance market (“Cyber Market”) has experienced rapid premium growth in recent years. Our analysis of NAIC Annual Statement data through year-end 2021 suggests the direct written premium (“DWP”) for the NAIC Cyber Market grew to approximately $4.8 billion in 2021, up 74% from $2.8 billion in 2020. The corresponding NAIC Cyber Market growth rates in 2020 and 2019 were 23% and 12%, respectively. Additionally, our analysis of Lloyd’s of London (“Lloyds”) data through year-end 2021 suggests the ultimate signed premium for the Lloyds Cyber Market will grow to $1.4 billion in underwriting year 2021, up 40% from the $1 billion estimated for underwriting year 2020. The corresponding Lloyds Cyber Market growth rates in underwriting years 2020 and 2019 are estimated to be 13% and 27%, respectively.
The Cyber Market’s recent growth follows deteriorating insurance results in preceding years. Specifically, the NAIC Cyber Market’s reported calendar year incurred loss and defense and cost containment expense (“DCCE”) ratios on Stand-Alone cyber policies have increased from 43% in 2016 to 73% in 2020. During this time, reported claim frequency increased 172%. Future calendar year results will provide insights as to whether companies have fully reserved for the increased cyber frequency. Further, our projected ultimate loss and DCCE ratio estimates for the Lloyds Cyber Market increased from a low of 37% in underwriting year 2015 to a high of 129% in underwriting year 2019.
Unfortunately, working from home due to COVID has led to increased Cyber incidents. According to Cloudwards, the rate of cyber crime increased by 600% during the COVID pandemic. The number of Cyber complaints reported to the FBI increased from 250,000 a year during the 2008 to 2018 years to over 750,000 a year in 2020 and 2021.
Despite the increase in Cyber incidents, insurance results improved in 2021. The NAIC Cyber Market’s calendar year 2021 incurred loss and DCCE ratio decreased to 65%, and our projected ultimate loss and DCCE ratios for the Lloyds Cyber Market decreased to 91% and 59% in underwriting years 2020 and 2021, respectively. However, the Lloyds results are highly uncertain due to the immaturity of the underwriting years as of year-end 2021.
We attribute this recent improvement to the combined effect of decreased frequency, increased rate levels and constrained capacity (e.g., increased deductibles, lower limits, refined policy terms, etc.). Specifically, within the 2021 NAIC Cyber Market, reported claim frequency decreased 14%, while large risks commonly experienced 100% to 150% rate increases, with the middle market often experiencing even larger increases. Considering DWP per policy has grown at a much slower pace than rates alone would suggest, we estimate the effective coverage per policy has decreased significantly.
All things considered; the results of our analysis suggest an improved Cyber Market in 2021. A significant question relates to the adequacy of prior accident year reserves.
The following sections detail the results of our analysis.
Cyber Market Growth
As illustrated in Chart 1 below, the NAIC Cyber Market has experienced significant growth in DWP since 2015:
Chart 1: NAIC Cyber Market Change in DWP by Calendar Year
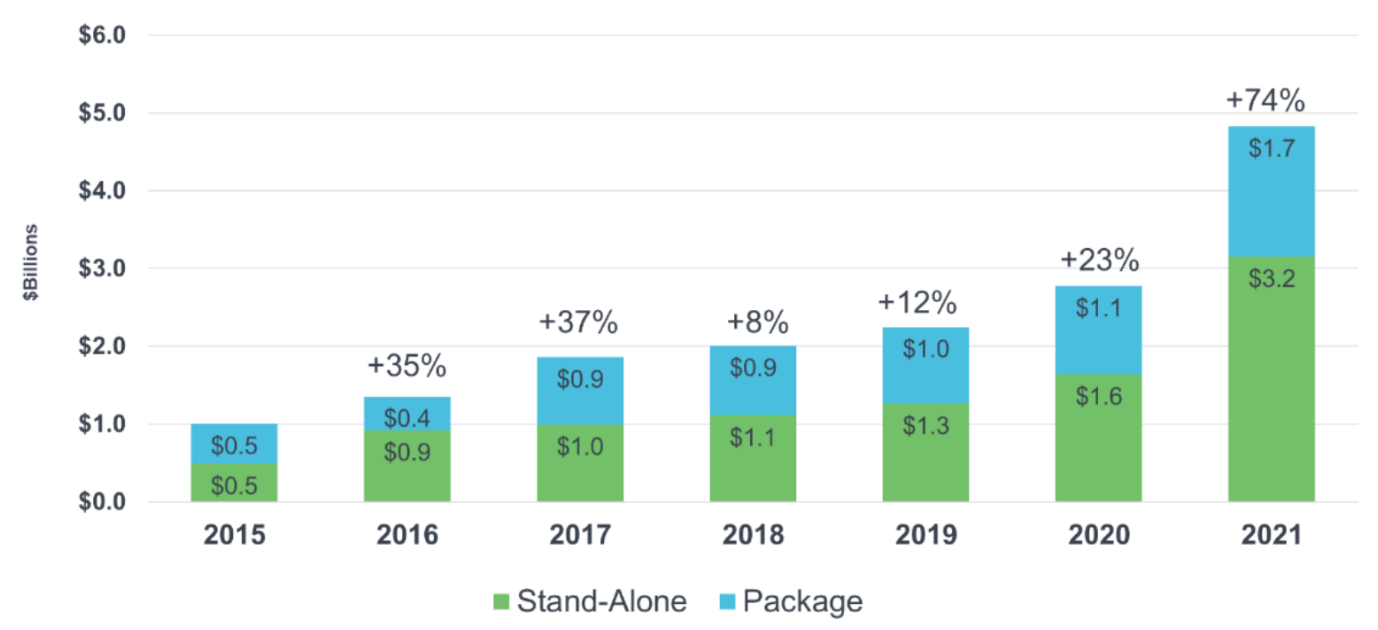
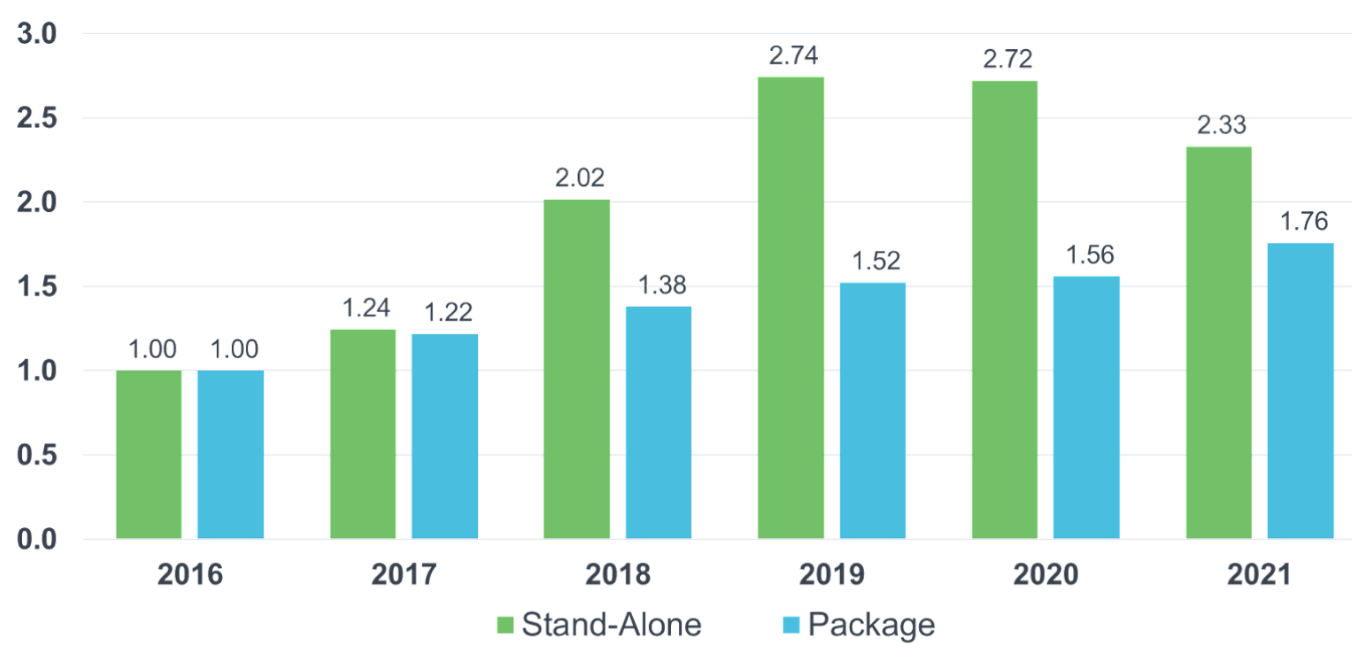
The DWP displayed in Chart 1 is composed of cyber premium stemming from Stand-Alone cyber policies (i.e., those policies designed specifically to cover cyber risks) and Package cyber policies (i.e., those policies where cyber coverage is offered in addition to other coverages). The NAIC Annual Statement requires companies to list cyber premium stemming from Package cyber policies as either “Quantified” or “Estimated.” We display this bifurcation in Table 1 below, along with DWP growth specific to Stand-Alone and Package cyber policies:
Table 1: NAIC Cyber Market Change in DWP by Calendar Year and Policy Type ($Millions)
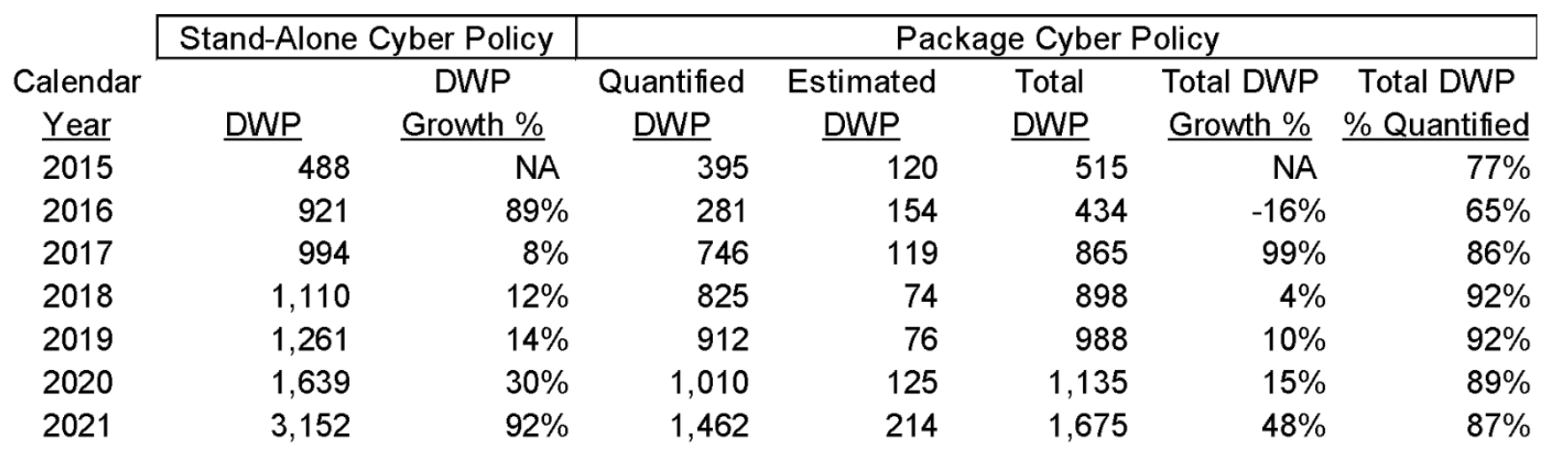
As Table 1 displays, “Quantified” cyber DWP has generally represented approximately 90% of the displayed DWP stemming from Package cyber policies since 2017. Table 1 also shows the DWP growth for Stand-Alone policies has recently outpaced the growth for Package policies, especially in 2021. We expect the demand for Stand-Alone cyber policies to continue to grow as the need for tailored coverage specific to cyber risks is becoming apparent among insureds, especially in light of war exclusions commonly listed, or generally accepted to apply, to Package policies.
As illustrated in Chart 2 below, the Lloyds Cyber Market has also experienced significant growth in premium in recent years:
Chart 2: Lloyds Cyber Market Ultimate Signed Premium by Underwriting Year ($Millions)
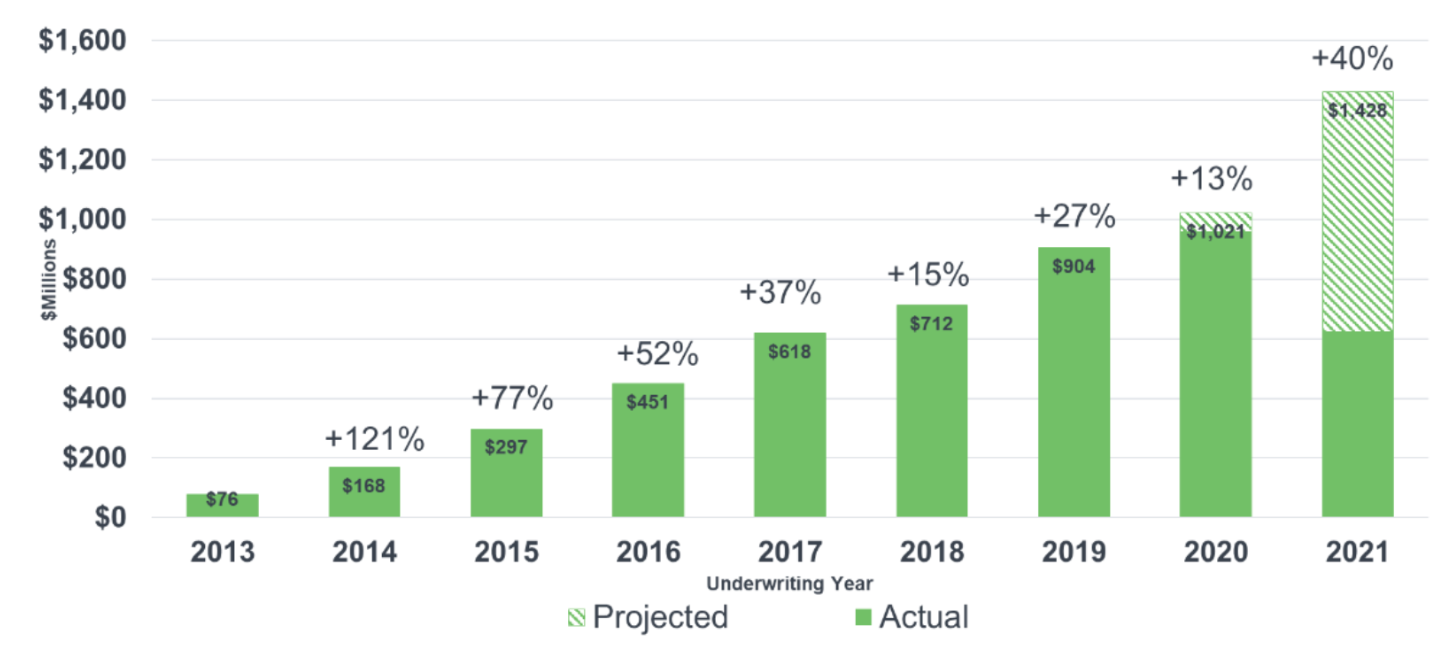
The DWP displayed in Chart 2 is composed of actual and projected signed premium. Our analysis of the Lloyds data suggests actual signed premium is at an ultimate level for underwriting years 2019 and prior, is near the estimated ultimate level for underwriting year 2020 and is less than half the estimated ultimate level for underwriting year 2021. As such, there is considerable uncertainty around the ultimate growth rate for underwriting year 2021. That being said, the 40% growth estimate does not seem unreasonable considering the $625 million of signed premium for underwriting year 2021, as of Dec. 31, is 43% higher than the corresponding signed premium of $437 million for underwriting year 2020, as of Dec. 31, 2020.
See also: Why Hasn't Cyber Security Advanced?
Cyber Market Insurance Results
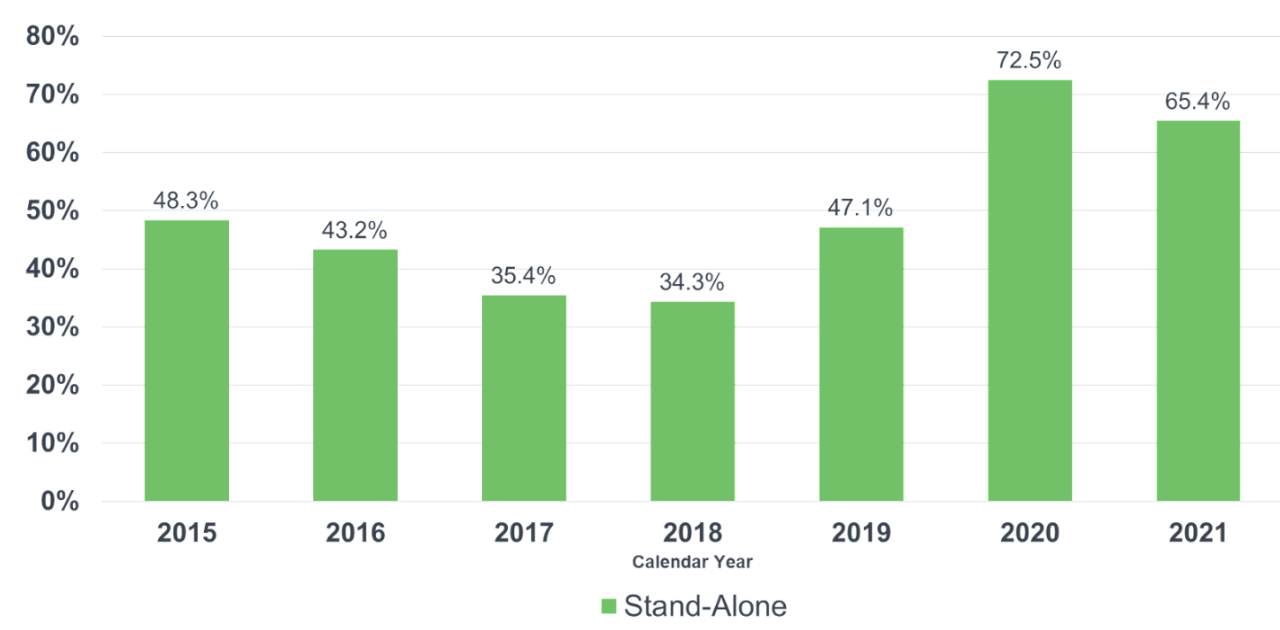
As illustrated in Chart 3 below, the NAIC Cyber Market insurance results deteriorated between calendar years 2018 and 2020, but improved in 2021:
Chart 3: US Cyber Market Incurred Loss & DCCE Ratios by Calendar Year – Stand-Alone Policies Only
As illustrated in Table 2 below, the Lloyds Cyber Market has also experienced a period of deteriorating insurance results with improved trends recently:
Table 2: Lloyds Cyber Market Reported Loss and DCCE Ratios by Underwriting Year
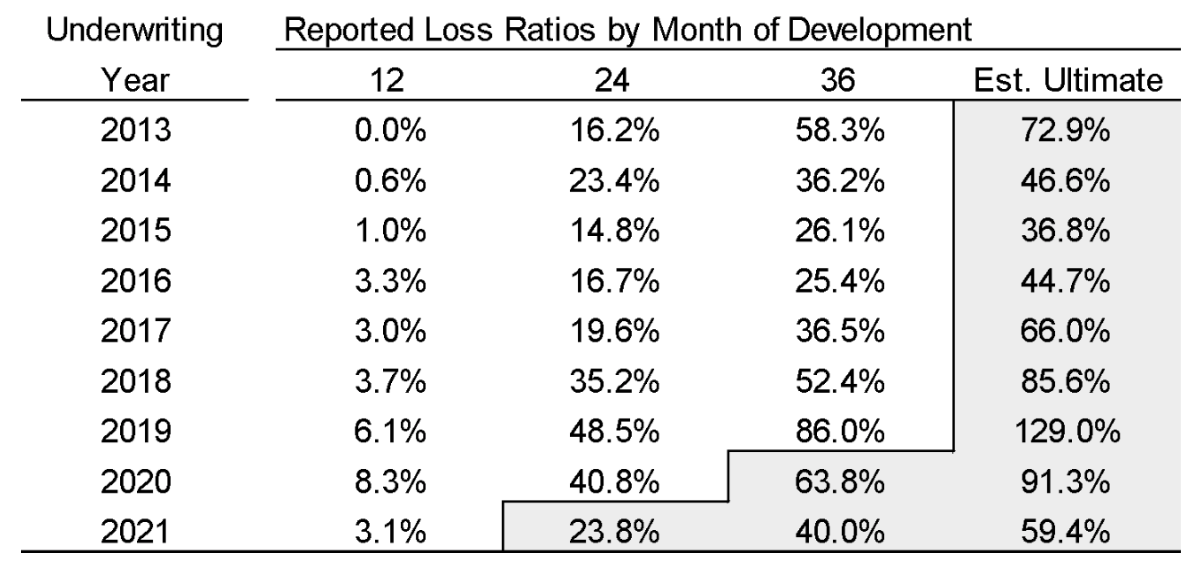
The Table 2 values shaded in grey represent our projected estimates based on our analysis of available information. The results for underwriting year 2021 are particularly uncertain given the year is still in the earning period. That being said, early evidence suggests the results for underwriting year 2021 could be significantly lower than 2019, which follows the apparent momentum of improved results in 2020.
A graphical depiction of the development of the Lloyds Cyber Market reported loss and DCCE ratios by underwriting year is displayed in Chart 4 below:
Chart 4: Lloyds Cyber Market Reported Loss and DCCE Ratios by Underwriting Year*
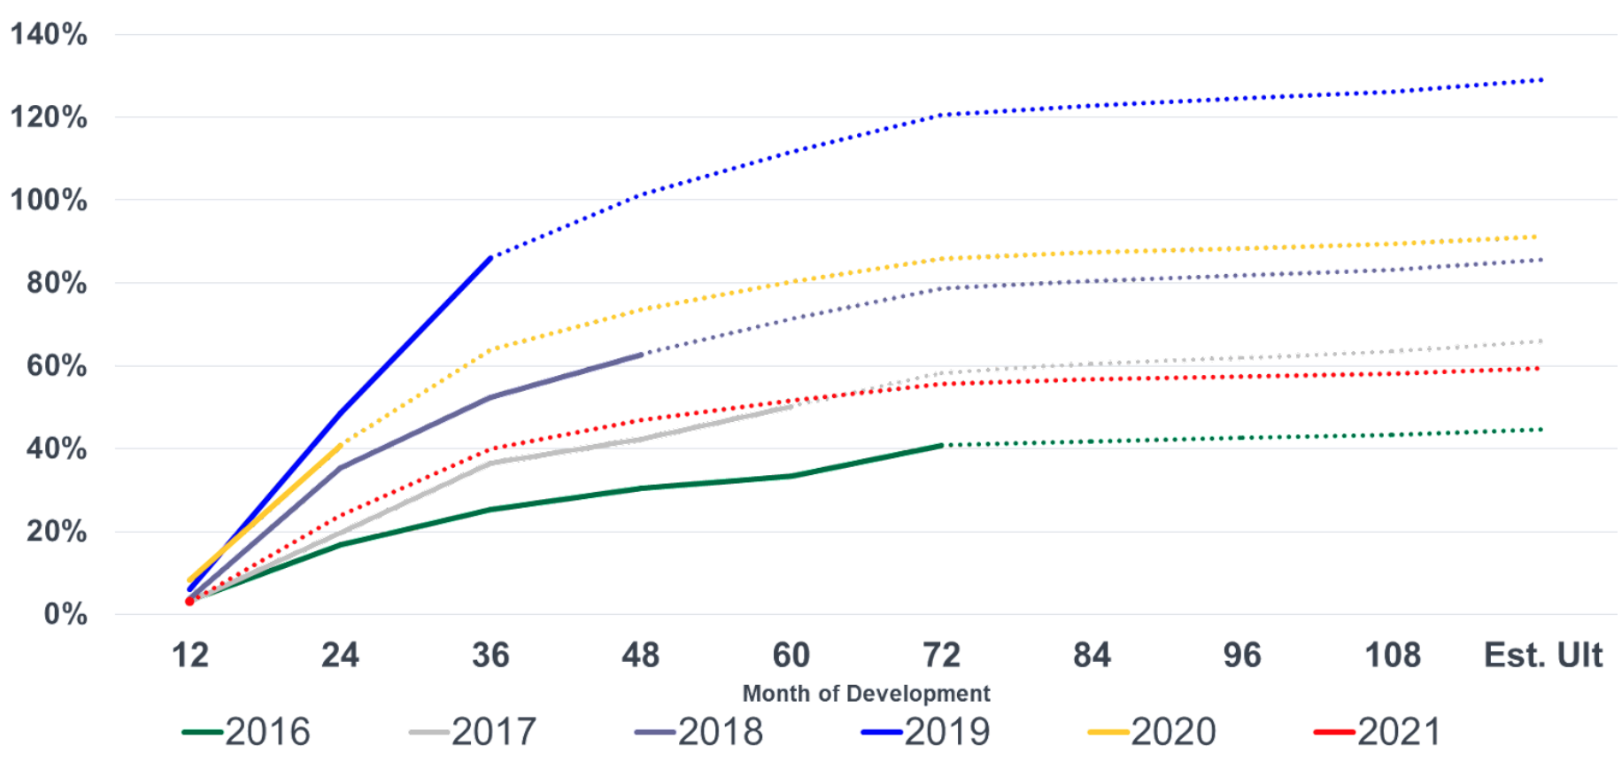
*Dotted lines represent our estimates of the development of reported loss and DCCE ratios to ultimate value.
Cyber Market Diagnostics / Discussion
The deterioration of NAIC Cyber Market insurance results between calendar years 2018 and 2020 follows a period of increased reported claim frequency between 2016 and 2019, as illustrated in Chart 5 below:
Chart 5: NAIC Relative Reported Claims per Policy – 2016 Base Period
There is an apparent lagged relationship between increased reported claim frequency and increased booked loss and DCCE ratios. Specifically, the increased 2018 and 2019 reported claim frequency measures displayed in Chart 5 above don’t appear to manifest as increased incurred loss and DCCE ratios until 2019 and 2020. This lagged relationship suggests initial booked reserves have likely been inadequate.
Also of concern is that the reported claim trends displayed in Chart 5 above imply the calendar year 2019 through 2021 incurred loss and DCCE ratios would be significantly higher than reported. That is, if the calendar year 2016 incurred loss and DCCE ratio of 43% was trended forward to 2019, 2020 and 2021 using only the reported claim trends displayed in Chart 5 the resulting incurred loss and DCCE ratios would be 118%, 118%, and 101%, respectively. These trended results do not account for recent rate increases, but are nonetheless significantly higher than the corresponding reported ratios of 47%, 73%, and 65%, respectively.
The significant reduction in reported claim frequency in 2021 may be explained by increased awareness of cyber threats among the general population, along with improved security protocols and more robust education on the risk by corporations. The trend toward higher deductibles may also contribute to the lower reported claim frequency recently.
The average NAIC DWP per in force Stand-Alone cyber policy increased to $12,161 in 2021 from $8,306 in 2020, an increase of 46%. Chart 6 below displays these average premiums back to 2015 for both Stand-Alone and Package cyber policies:
Chart 6: Average NAIC DWP per In-Force Policy
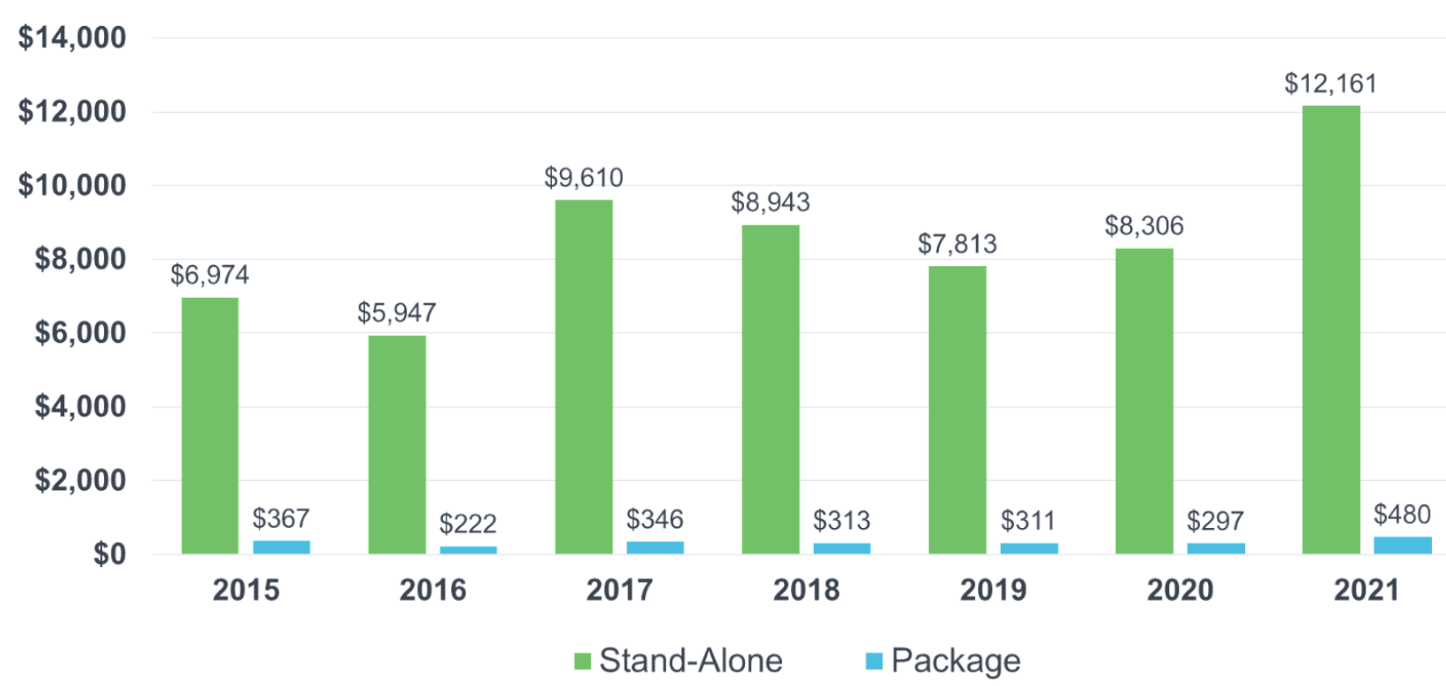
Considering average U.S. cyber rates were estimated by many parties to increase by 100% in 2021, the implication is coverage was significantly reduced likely due to a combination of increased deductibles and reduced policy limits.
Recent Claim Department Responses
The increase in ransomware and data breach events have led to more changes in claim departments:
- Insurers continue to add claims technical staff and reimagine business process and vendor relationships to improve efficiency and reduce loss and DCCE. There is evidence of insurers building incident response technical teams as these costs fluctuate with demand.
- Talent shortages have begun to show in claim teams, law firms and vendors.
- There is a lack of surge capacity in the vendor marketplace.
- The COVID-19 pandemic exposed the heavy reliance of insurers on third-party professionals to render response services where there are now growing questions of surge capacity. Insurers may be left exposed for lack of timeliness in responding or subject to higher costs.
- Brokers are left to assist clients that have recently uninsured or that have significant retentions. Enhanced broker services are being developed to fill the services gap.
- The speed of cyber incident response continues to quicken, and the demand and cost for specialized claims services continues to increase.
- Data breach class action litigation continues to rise.
- Claim handling data gathering and the use of analytics is growing.
- There is more focus on planning for incidence response surges, suggesting that insurers nourish service development and competition. Specifically, law firms specialized in incident response, forensics, e-discovery, call centers and identity theft and fraud monitoring and restoration provider.
Ransomware losses, which began to affect portfolios heavily commencing in 2019, are quicker to settle than data breaches, which are more prominent in prior years’ losses. Despite the purported lower latency, there is an increase in case reserves.
Brokers likewise are taking a more active role in vendor due diligence and selection for their clients and looking specifically for improved services for identity monitoring that go beyond credit monitoring to include health data, social media profiles and services for minors and high wealth individuals. Expanded services offerings are expected and needed to avoid or mitigate the potential for litigation and maintain goodwill with consumers.
See also: Excess & Surplus Lines Market Hardens Further
Concluding Remarks
While the Cyber Market has significantly improved in 2021, increases to prior coverage year reserves may create a significant drag on earnings. Also, the instability caused by the Russian invasion of Ukraine and the potential for a cyber catastrophe creates a very uncertain future.
All NAIC data referenced in this article was provided by S&P Global Market Intelligence, unless otherwise noted. All Lloyds data referenced in this article was provided by Xchanging, unless otherwise noted.
For further information, please reach out to the authors.