The current year has been characterized by increasing daily volatility in financial asset prices. This is occurring in bonds as well as stocks. In fact, through the first six months of this year, the major equity markets have been trading within a narrow price band, back and forth, back and forth. Enough to induce seasickness among the investment community.
The S&P 500 ended 2014 at 2058. On June 30, 2015, the S&P closed at 2063. In other words, the S&P spent six months going up all of five points, or 0.2%. Yet if we look at the daily change in the S&P price, the S&P actually traveled 1,544 points, daily closing price to daily closing price, in the first six months of the year. Dramamine, anyone?
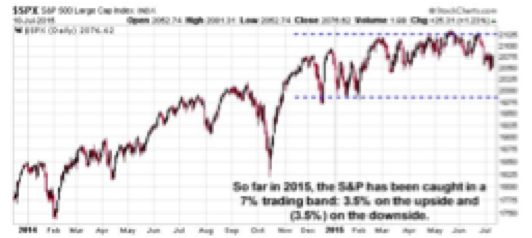
Price volatility seems to have increased, but point-to-point percentage price moves have actually been very small. When looked at within the context of an entire bull market cycle, a 3.5% price move in either direction is close to a rounding error. This is the face of volatility we have experienced over the first half of 2015. Not quite as scary as is portrayed in the media, right?
In one sense, what we have really experienced this year is what is termed a “sideways correction.”
Financial markets can correct in any number of ways. We usually think of a correction in prices as a meaningful drop. That is certainly one form of a correction, and never much fun. Markets can also correct in sideways fashion. In a sideways correction, the markets go back and forth, often waiting for fundamentals of the economy and corporate earnings to catch up with prices that have already moved. The markets are digesting prior gains. Time for a “time out.”
At least so far, this is what appears to be occurring this year. Make no mistake about it, sideways corrections heighten the perception of price volatility. That’s why it is so important to step away from the day to day and look at longer-term market character. A key danger for investors is allowing day-to-day price volatility to influence emotions, and heightened emotions to influence investment decision making.
Two issues we do believe to be very important at this stage of the market cycle are safety and liquidity. We live in a world where central banks are openly debasing their currencies, where government balance sheets are deteriorating, where governments (to greater or lesser degrees) are increasing the hunt for taxes and where cash left in certain banking systems is being charged a fee (negative interest rates) just to sit. None of these actions is friendly to capital, which is why we see so much global capital on the move.
It’s simply seeking safety and liquidity. Is that too much to ask?
To understand where the money may go, it's important to look at the size and character of major global asset classes. In the chart below, we look at real estate and bond (credit) and stock markets. We’ve additionally shown the global money supply and gold.
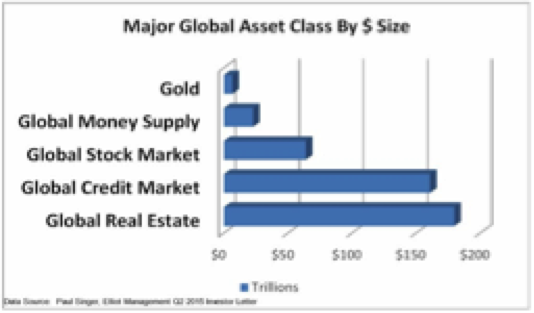 One of the key takeaways from this data is that the global credit/bond market is about 2.5 times as large as the global equity market. We have expressed our longer-term concern over bonds, especially government bonds. After 35 years of a bull market in bonds, will we have another 35 years of such good fortune? Not a chance. With interest rates at generational lows, the 35-year bond bull market isn’t in the final innings; it’s already in extra innings, thanks to the money printing antics of global central banks. So as we think ahead, we need to contemplate a very important question. What happens to this $160 trillion-plus investment in the global bond market when the 35-year bond bull market breathes its last and the downside begins?
One answer is that some of this capital will go to what is termed “money heaven.” It will never be seen again; it will simply be lost. Another possible outcome is that the money reallocates to an alternative asset class. Could 5% of the total bond market move to gold? Probably not, as this is a sum larger than total global gold holdings. Will it move to real estate? Potentially, but real estate is already the largest asset class in nominal dollar size globally. Could it reallocate to stocks? This is another potential outcome. Think about pension funds that are not only underfunded but have specific rate-of-return mandates. Can they stand there and watch their bond holdings decline? Never. They will be forced to sell bonds and reallocate the proceeds. The question is where. Other large institutional investors face the same issue. Equities may be a key repository in a world where global capital is seeking safety and liquidity. Again, only a potential outcome.
We simply need to watch the movement of global capital and how that is expressed in the forward price of these key global asset classes. Watching where the S&P ultimately moves out of this currently tight trading range seen this year will be very important. It will be a signal as to where global capital is moving at the margin among the major global assets classes.
Checking our emotions at the door is essential. Not getting caught up or emotionally influenced in the up and down of day-to-day price movement is essential. Putting price volatility and market movement into much broader perspective allows us to step back and see the larger global picture of capital movement.
These are the important issues, not where the S&P closes tomorrow, or the next day. Or, for that matter, the day after that.
One of the key takeaways from this data is that the global credit/bond market is about 2.5 times as large as the global equity market. We have expressed our longer-term concern over bonds, especially government bonds. After 35 years of a bull market in bonds, will we have another 35 years of such good fortune? Not a chance. With interest rates at generational lows, the 35-year bond bull market isn’t in the final innings; it’s already in extra innings, thanks to the money printing antics of global central banks. So as we think ahead, we need to contemplate a very important question. What happens to this $160 trillion-plus investment in the global bond market when the 35-year bond bull market breathes its last and the downside begins?
One answer is that some of this capital will go to what is termed “money heaven.” It will never be seen again; it will simply be lost. Another possible outcome is that the money reallocates to an alternative asset class. Could 5% of the total bond market move to gold? Probably not, as this is a sum larger than total global gold holdings. Will it move to real estate? Potentially, but real estate is already the largest asset class in nominal dollar size globally. Could it reallocate to stocks? This is another potential outcome. Think about pension funds that are not only underfunded but have specific rate-of-return mandates. Can they stand there and watch their bond holdings decline? Never. They will be forced to sell bonds and reallocate the proceeds. The question is where. Other large institutional investors face the same issue. Equities may be a key repository in a world where global capital is seeking safety and liquidity. Again, only a potential outcome.
We simply need to watch the movement of global capital and how that is expressed in the forward price of these key global asset classes. Watching where the S&P ultimately moves out of this currently tight trading range seen this year will be very important. It will be a signal as to where global capital is moving at the margin among the major global assets classes.
Checking our emotions at the door is essential. Not getting caught up or emotionally influenced in the up and down of day-to-day price movement is essential. Putting price volatility and market movement into much broader perspective allows us to step back and see the larger global picture of capital movement.
These are the important issues, not where the S&P closes tomorrow, or the next day. Or, for that matter, the day after that.