In our last article, When Nature Calls, we looked back at an insurance industry reeling from several consecutive natural catastrophes that generated combined insured losses exceeding $30 billion. Those massive losses were a direct result of an industry overconfident in its ability to gauge the frequency and severity of catastrophic events. Insurers were using only history and their limited experience as their guide, resulting in a tragic loss of years’ worth of policyholder surplus.
The turmoil of this period cannot be overstated. Many insurers went insolvent, and those that survived needed substantial capital infusions to continue functioning. Property owners in many states were left with no affordable options for adequate coverage and, in many cases, were forced to go without any coverage at all. The property markets seized up. Without the ability to properly estimate how catastrophic events would affect insured properties, it looked as though the market would remain broken indefinitely.
Luckily, in the mid 1980s, two people on different sides of the country were already working on solutions to this daunting problem. Both had asked themselves: If the problem is lack of data because of the rarity of recorded historical catastrophic events, then could we plug the historical data available now, along with mechanisms for how catastrophic events behave, into a computer and then extrapolate the full picture of the historical data needed? Could we then take that data and create a catalog of millions of simulated events occurring over thousands of years and use it to tell us where and how often we can expect events to occur, as well as how severe they could be? The answer was unequivocally yes, but with caveats.
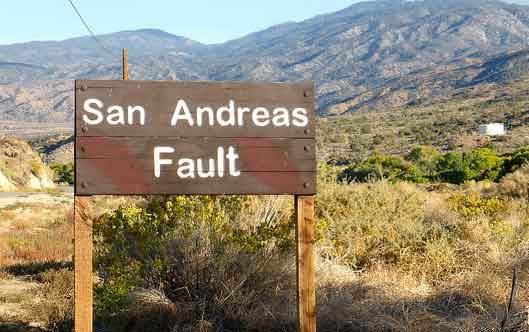
In 1987, Karen Clark, a former insurance executive out of Boston, formed Applied Insurance Research (now AIR Worldwide). She spent much of the 1980s with a team of researchers and programmers designing a system that could estimate where hurricanes would strike the coastal U.S., how often they would strike and ultimately, based on input insurance policy terms and conditions, how much loss an insurer could expect from those events. Simultaneously, on the West Coast at Stanford University, Hemant Shah was completing his graduate degree in engineering and attempting to answer those same questions, only he was focusing on the effects of earthquakes occurring around Los Angeles and San Francisco.
In 1988, Clark released the first commercially available catastrophe model for U.S. hurricanes. Shah released his earthquake model a year later through his company, Risk Management Solutions (RMS). Their models were incredibly slow, limited and, according to many insurers, unnecessary. However, for the first time, loss estimates were being calculated based on actual scientific data of the day along with extrapolated probability and statistics in place of the extremely limited historical data previously used. These new “modeled” loss estimates were not in line with what insurers were used to seeing and certainly could not be justified based on historical record.
Clark’s model generated hurricane storm losses in the tens of billions of dollars while, up until that point, the largest insured loss ever recorded did not even reach $1 billion! Insurers scoffed at the comparison. But all of that quickly changed in August 1992, when Hurricane Andrew struck southern Florida.
Using her hurricane model, Clark estimated that insured losses from Andrew might exceed $13 billion. Even in the face of heavy industry doubt, Clark published her prediction. She was immediately derided and questioned by her peers, the press and virtually everyone around. They said her estimates were unprecedented and far too high. In the end, though, when it turned out that actual losses, as recorded by Property Claims Services, exceeded $15 billion, a virtual catastrophe model feeding frenzy began. Insurers quickly changed their tune and began asking AIR and RMS for model demonstrations. The property insurance market would never be the same.
So what exactly are these revolutionary models, which are now affectionately referred to as “cat models?”
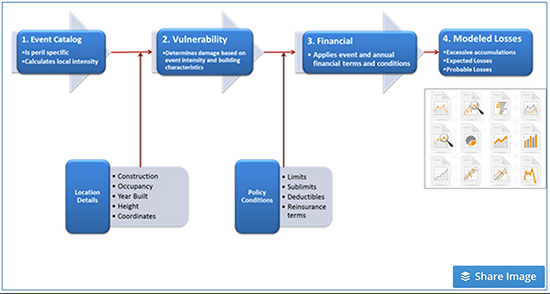
Regardless of the model vendor, every cat model uses the same three components:
 When cat models first became commercially available, industry adoption was slow. It took Hurricane Andrew in 1992 followed by the Northridge earthquake in 1994 to literally and figuratively shake the industry out of its overconfidence. Reinsurers and large insurers were the first to use the models, mostly due to their vast exposure to loss and their ability to afford the high license fees. Over time, however, much of the industry followed suit. Insurers that were unable to afford the models (or who were skeptical of them) could get access to all the available major models via reinsurance brokers that, at that time, also began rolling out suites of analytic solutions around catastrophe model results.
Today, the models are ubiquitous in the industry. Rating agencies require model output based on prescribed model parameters in their supplementary rating questionnaires to understand whether or not insurers can economically withstand certain levels of catastrophic loss. Reinsurers expect insurers to provide modeled loss output on their submissions when applying for reinsurance. The state of Florida has even set up a commission, the Florida Commission on Loss Prevention Methodology, which consists of “an independent body of experts created by the Florida Legislature in 1995 for the purpose of developing standards and reviewing hurricane loss models used in the development of residential property insurance rates and the calculation of probable maximum loss levels.”
Models are available for tropical cyclones, extra tropical cyclones, earthquakes, tornados, hail, coastal and inland flooding, tsunamis and even for pandemics and certain types of terrorist attacks. The first set of models started out as simulated catastrophes for U.S.-based perils, but now models exist globally for countries in Europe, Australia, Japan, China and South America.
In an effort to get ahead of the potential impact of climate change, all leading model vendors even provide U.S. hurricane event catalogs, which simulate potential catastrophic scenarios under the assumption that the Atlantic Ocean sea-surface temperatures will be warmer on average. And with advancing technologies, open-source platforms are being developed, which will help scores of researchers working globally on catastrophes to become entrepreneurs by allowing “plug and play” use of their models. This is the virtual equivalent of a cat modeling app store.
Catastrophe models have provided the insurance industry with an innovative solution to a major problem. Ironically, the solution itself is now an industry in its own right, as estimated revenues from model licenses now annually exceed $500 million (based on conversations with industry experts).
But how have the models performed over time? Have they made a difference in the industry’s ability to help manage catastrophic loss? Those are not easy questions to answer, but we believe they have. All the chaos from Hurricane Andrew and the Northridge earthquake taught the industry some invaluable lessons. After the horrific 2004 and 2005 hurricane seasons, which ravaged Florida with four major hurricanes in a single year, followed by a year that saw two major hurricanes striking the Gulf Coast – one of them being Hurricane Katrina, the single most costly natural disaster in history – there were no ensuing major insurance company insolvencies. This was a profound success.
The industry withstood a two-year period of major catastrophic losses. Clearly, something had changed. Cat models played a significant role in this transformation. The hurricane losses from 2004 and 2005 were large and painful, but did not come as a surprise. Using model results, the industry now had a framework to place those losses in proper context. In fact, each model vendor has many simulated hurricane events in their catalogs, which resemble Hurricane Katrina. Insurers knew, from the models, that Katrina could happen and were therefore prepared for that possible, albeit unlikely, outcome.
However, with the universal use of cat models in property insurance comes other issues. Are we misusing these tools? Are we becoming overly dependent on them? Are models being treated as a panacea to vexing business and scientific questions instead of as the simple framework for understanding potential loss?
Next in this series, we will illustrate how modeling results are being used in the industry and how overconfidence in the models could, once again, lead to crisis.
When cat models first became commercially available, industry adoption was slow. It took Hurricane Andrew in 1992 followed by the Northridge earthquake in 1994 to literally and figuratively shake the industry out of its overconfidence. Reinsurers and large insurers were the first to use the models, mostly due to their vast exposure to loss and their ability to afford the high license fees. Over time, however, much of the industry followed suit. Insurers that were unable to afford the models (or who were skeptical of them) could get access to all the available major models via reinsurance brokers that, at that time, also began rolling out suites of analytic solutions around catastrophe model results.
Today, the models are ubiquitous in the industry. Rating agencies require model output based on prescribed model parameters in their supplementary rating questionnaires to understand whether or not insurers can economically withstand certain levels of catastrophic loss. Reinsurers expect insurers to provide modeled loss output on their submissions when applying for reinsurance. The state of Florida has even set up a commission, the Florida Commission on Loss Prevention Methodology, which consists of “an independent body of experts created by the Florida Legislature in 1995 for the purpose of developing standards and reviewing hurricane loss models used in the development of residential property insurance rates and the calculation of probable maximum loss levels.”
Models are available for tropical cyclones, extra tropical cyclones, earthquakes, tornados, hail, coastal and inland flooding, tsunamis and even for pandemics and certain types of terrorist attacks. The first set of models started out as simulated catastrophes for U.S.-based perils, but now models exist globally for countries in Europe, Australia, Japan, China and South America.
In an effort to get ahead of the potential impact of climate change, all leading model vendors even provide U.S. hurricane event catalogs, which simulate potential catastrophic scenarios under the assumption that the Atlantic Ocean sea-surface temperatures will be warmer on average. And with advancing technologies, open-source platforms are being developed, which will help scores of researchers working globally on catastrophes to become entrepreneurs by allowing “plug and play” use of their models. This is the virtual equivalent of a cat modeling app store.
Catastrophe models have provided the insurance industry with an innovative solution to a major problem. Ironically, the solution itself is now an industry in its own right, as estimated revenues from model licenses now annually exceed $500 million (based on conversations with industry experts).
But how have the models performed over time? Have they made a difference in the industry’s ability to help manage catastrophic loss? Those are not easy questions to answer, but we believe they have. All the chaos from Hurricane Andrew and the Northridge earthquake taught the industry some invaluable lessons. After the horrific 2004 and 2005 hurricane seasons, which ravaged Florida with four major hurricanes in a single year, followed by a year that saw two major hurricanes striking the Gulf Coast – one of them being Hurricane Katrina, the single most costly natural disaster in history – there were no ensuing major insurance company insolvencies. This was a profound success.
The industry withstood a two-year period of major catastrophic losses. Clearly, something had changed. Cat models played a significant role in this transformation. The hurricane losses from 2004 and 2005 were large and painful, but did not come as a surprise. Using model results, the industry now had a framework to place those losses in proper context. In fact, each model vendor has many simulated hurricane events in their catalogs, which resemble Hurricane Katrina. Insurers knew, from the models, that Katrina could happen and were therefore prepared for that possible, albeit unlikely, outcome.
However, with the universal use of cat models in property insurance comes other issues. Are we misusing these tools? Are we becoming overly dependent on them? Are models being treated as a panacea to vexing business and scientific questions instead of as the simple framework for understanding potential loss?
Next in this series, we will illustrate how modeling results are being used in the industry and how overconfidence in the models could, once again, lead to crisis.
- Event Catalog – A catalog of hypothetical stochastic (randomized) events, which informs the modeler about the frequency and severity of catastrophic events. The events contained in the catalog are based on millions of years of computerized simulations using recorded historical data, scientific estimation and the physics of how these types of events are formed and behave. Additionally, for each of these events, associated hazard and local intensity data is available, which answers the questions: Where? How big? And how often?
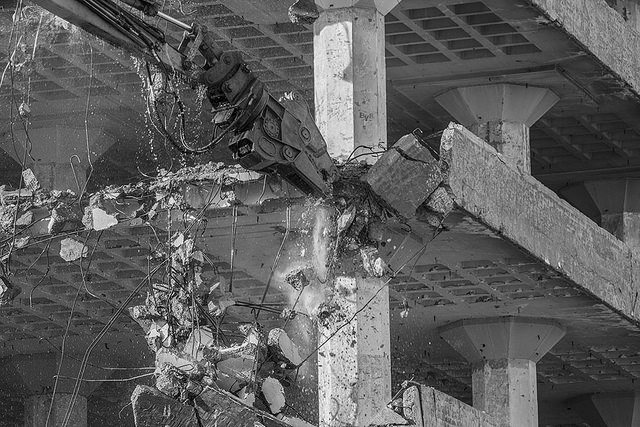
- Damage Estimation – The models employ damage functions, which describe the mathematical interaction between building structure and event intensity, including both their structural and nonstructural components, as well as their contents and the local intensity to which they are exposed. The damage functions have been developed by experts in wind and structural engineering and are based on published engineering research and engineering analyses. They have also been validated based on results of extensive damage surveys undertaken in the aftermath of catastrophic events and on billions of dollars of actual industry claims data.
- Financial Loss – The financial module calculates the final losses after applying all limits and deductibles on a damaged structure. These losses can be linked back to events with specific probabilities of occurrence. Now an insurer not only knows what it is exposed to, but also what its worst-case scenarios are and how frequently those may occur.
When cat models first became commercially available, industry adoption was slow. It took Hurricane Andrew in 1992 followed by the Northridge earthquake in 1994 to literally and figuratively shake the industry out of its overconfidence. Reinsurers and large insurers were the first to use the models, mostly due to their vast exposure to loss and their ability to afford the high license fees. Over time, however, much of the industry followed suit. Insurers that were unable to afford the models (or who were skeptical of them) could get access to all the available major models via reinsurance brokers that, at that time, also began rolling out suites of analytic solutions around catastrophe model results.
Today, the models are ubiquitous in the industry. Rating agencies require model output based on prescribed model parameters in their supplementary rating questionnaires to understand whether or not insurers can economically withstand certain levels of catastrophic loss. Reinsurers expect insurers to provide modeled loss output on their submissions when applying for reinsurance. The state of Florida has even set up a commission, the Florida Commission on Loss Prevention Methodology, which consists of “an independent body of experts created by the Florida Legislature in 1995 for the purpose of developing standards and reviewing hurricane loss models used in the development of residential property insurance rates and the calculation of probable maximum loss levels.”
Models are available for tropical cyclones, extra tropical cyclones, earthquakes, tornados, hail, coastal and inland flooding, tsunamis and even for pandemics and certain types of terrorist attacks. The first set of models started out as simulated catastrophes for U.S.-based perils, but now models exist globally for countries in Europe, Australia, Japan, China and South America.
In an effort to get ahead of the potential impact of climate change, all leading model vendors even provide U.S. hurricane event catalogs, which simulate potential catastrophic scenarios under the assumption that the Atlantic Ocean sea-surface temperatures will be warmer on average. And with advancing technologies, open-source platforms are being developed, which will help scores of researchers working globally on catastrophes to become entrepreneurs by allowing “plug and play” use of their models. This is the virtual equivalent of a cat modeling app store.
Catastrophe models have provided the insurance industry with an innovative solution to a major problem. Ironically, the solution itself is now an industry in its own right, as estimated revenues from model licenses now annually exceed $500 million (based on conversations with industry experts).
But how have the models performed over time? Have they made a difference in the industry’s ability to help manage catastrophic loss? Those are not easy questions to answer, but we believe they have. All the chaos from Hurricane Andrew and the Northridge earthquake taught the industry some invaluable lessons. After the horrific 2004 and 2005 hurricane seasons, which ravaged Florida with four major hurricanes in a single year, followed by a year that saw two major hurricanes striking the Gulf Coast – one of them being Hurricane Katrina, the single most costly natural disaster in history – there were no ensuing major insurance company insolvencies. This was a profound success.
The industry withstood a two-year period of major catastrophic losses. Clearly, something had changed. Cat models played a significant role in this transformation. The hurricane losses from 2004 and 2005 were large and painful, but did not come as a surprise. Using model results, the industry now had a framework to place those losses in proper context. In fact, each model vendor has many simulated hurricane events in their catalogs, which resemble Hurricane Katrina. Insurers knew, from the models, that Katrina could happen and were therefore prepared for that possible, albeit unlikely, outcome.
However, with the universal use of cat models in property insurance comes other issues. Are we misusing these tools? Are we becoming overly dependent on them? Are models being treated as a panacea to vexing business and scientific questions instead of as the simple framework for understanding potential loss?
Next in this series, we will illustrate how modeling results are being used in the industry and how overconfidence in the models could, once again, lead to crisis.