Many could not wait for 2020 to end, and numerous summaries highlighting the many different catastrophes and their impact on the insurance industry have been published. However, there is a need to put things into perspective at times, and this article looks to highlight a few unique aspects of 2020 and the catastrophes that have not been widely reported that have helped the insurance industry.
There is no escaping all the news about all the catastrophes in 2020 that have totaled $83 billion according to Swiss Re and $82 billion according to Munich Re. However, what is not widely mentioned in all of the various discussions is how normal these losses are. According to AIR Worldwide (AIR) and its 2020 Global Modeled Catastrophe Losses report, the average annual loss (AAL) is modeled at $99.6 billion. The 1% aggregate exceedance probability insured loss (or the 100-year return period loss) is nearly $301 billion. This is not a complete apples-to-apples analysis, as there are catastrophic events that occurred in 2020 that could not be modeled; however, the broader point is that, overall, losses appear to be what the insurance industry should expect in any given year.
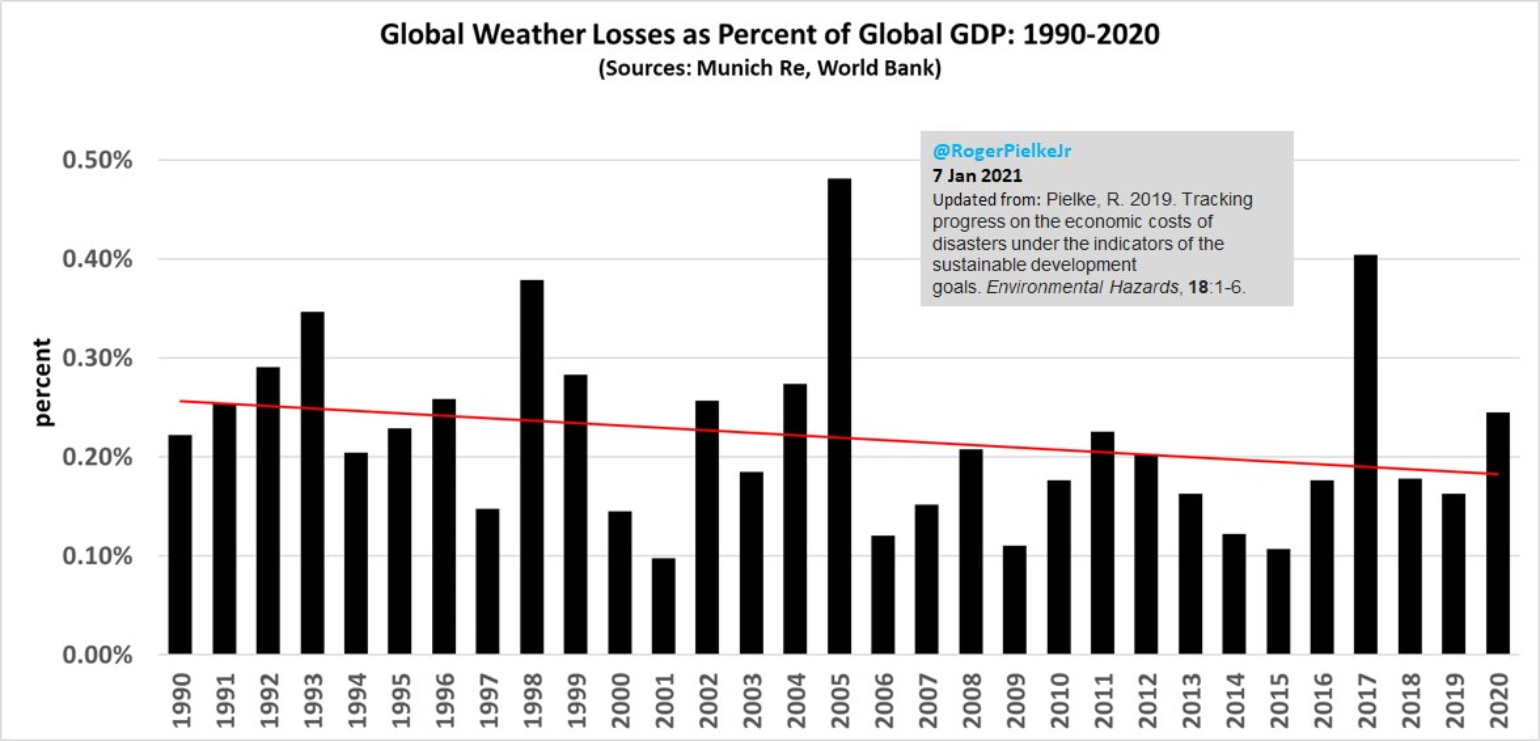
The numbers are a good reminder not to put much weight on trends in economic or insured losses and to measure catastrophic trends in the perils that cause the loss; there are just so many moving parts. Roger Pielke Jr., a professor at the University of Colorado, continues to lead this area of analysis by putting losses into perspective. Along with the comments from the Intergovernmental Panel on Climate Change, which mentions that “increasing exposure of people and economic assets has been the major cause of long-term increases in economic losses from weather- and climate-related disasters (high confidence)," Pielke for over a decade has analyzed global disasters as a proportion of global GDP data provided by Munich Re and the World Bank. The latest research continues to headline a long-term downward trend; even with global GDP declining due to COVID-19, his analysis shows that, while there are loss complexities due to social-economic issues, overall the losses could have been worse. The following three sections are highlights as to some of the reasons that have not been mentioned in a lot of these annual reports.
Severe Weather-Related Observations
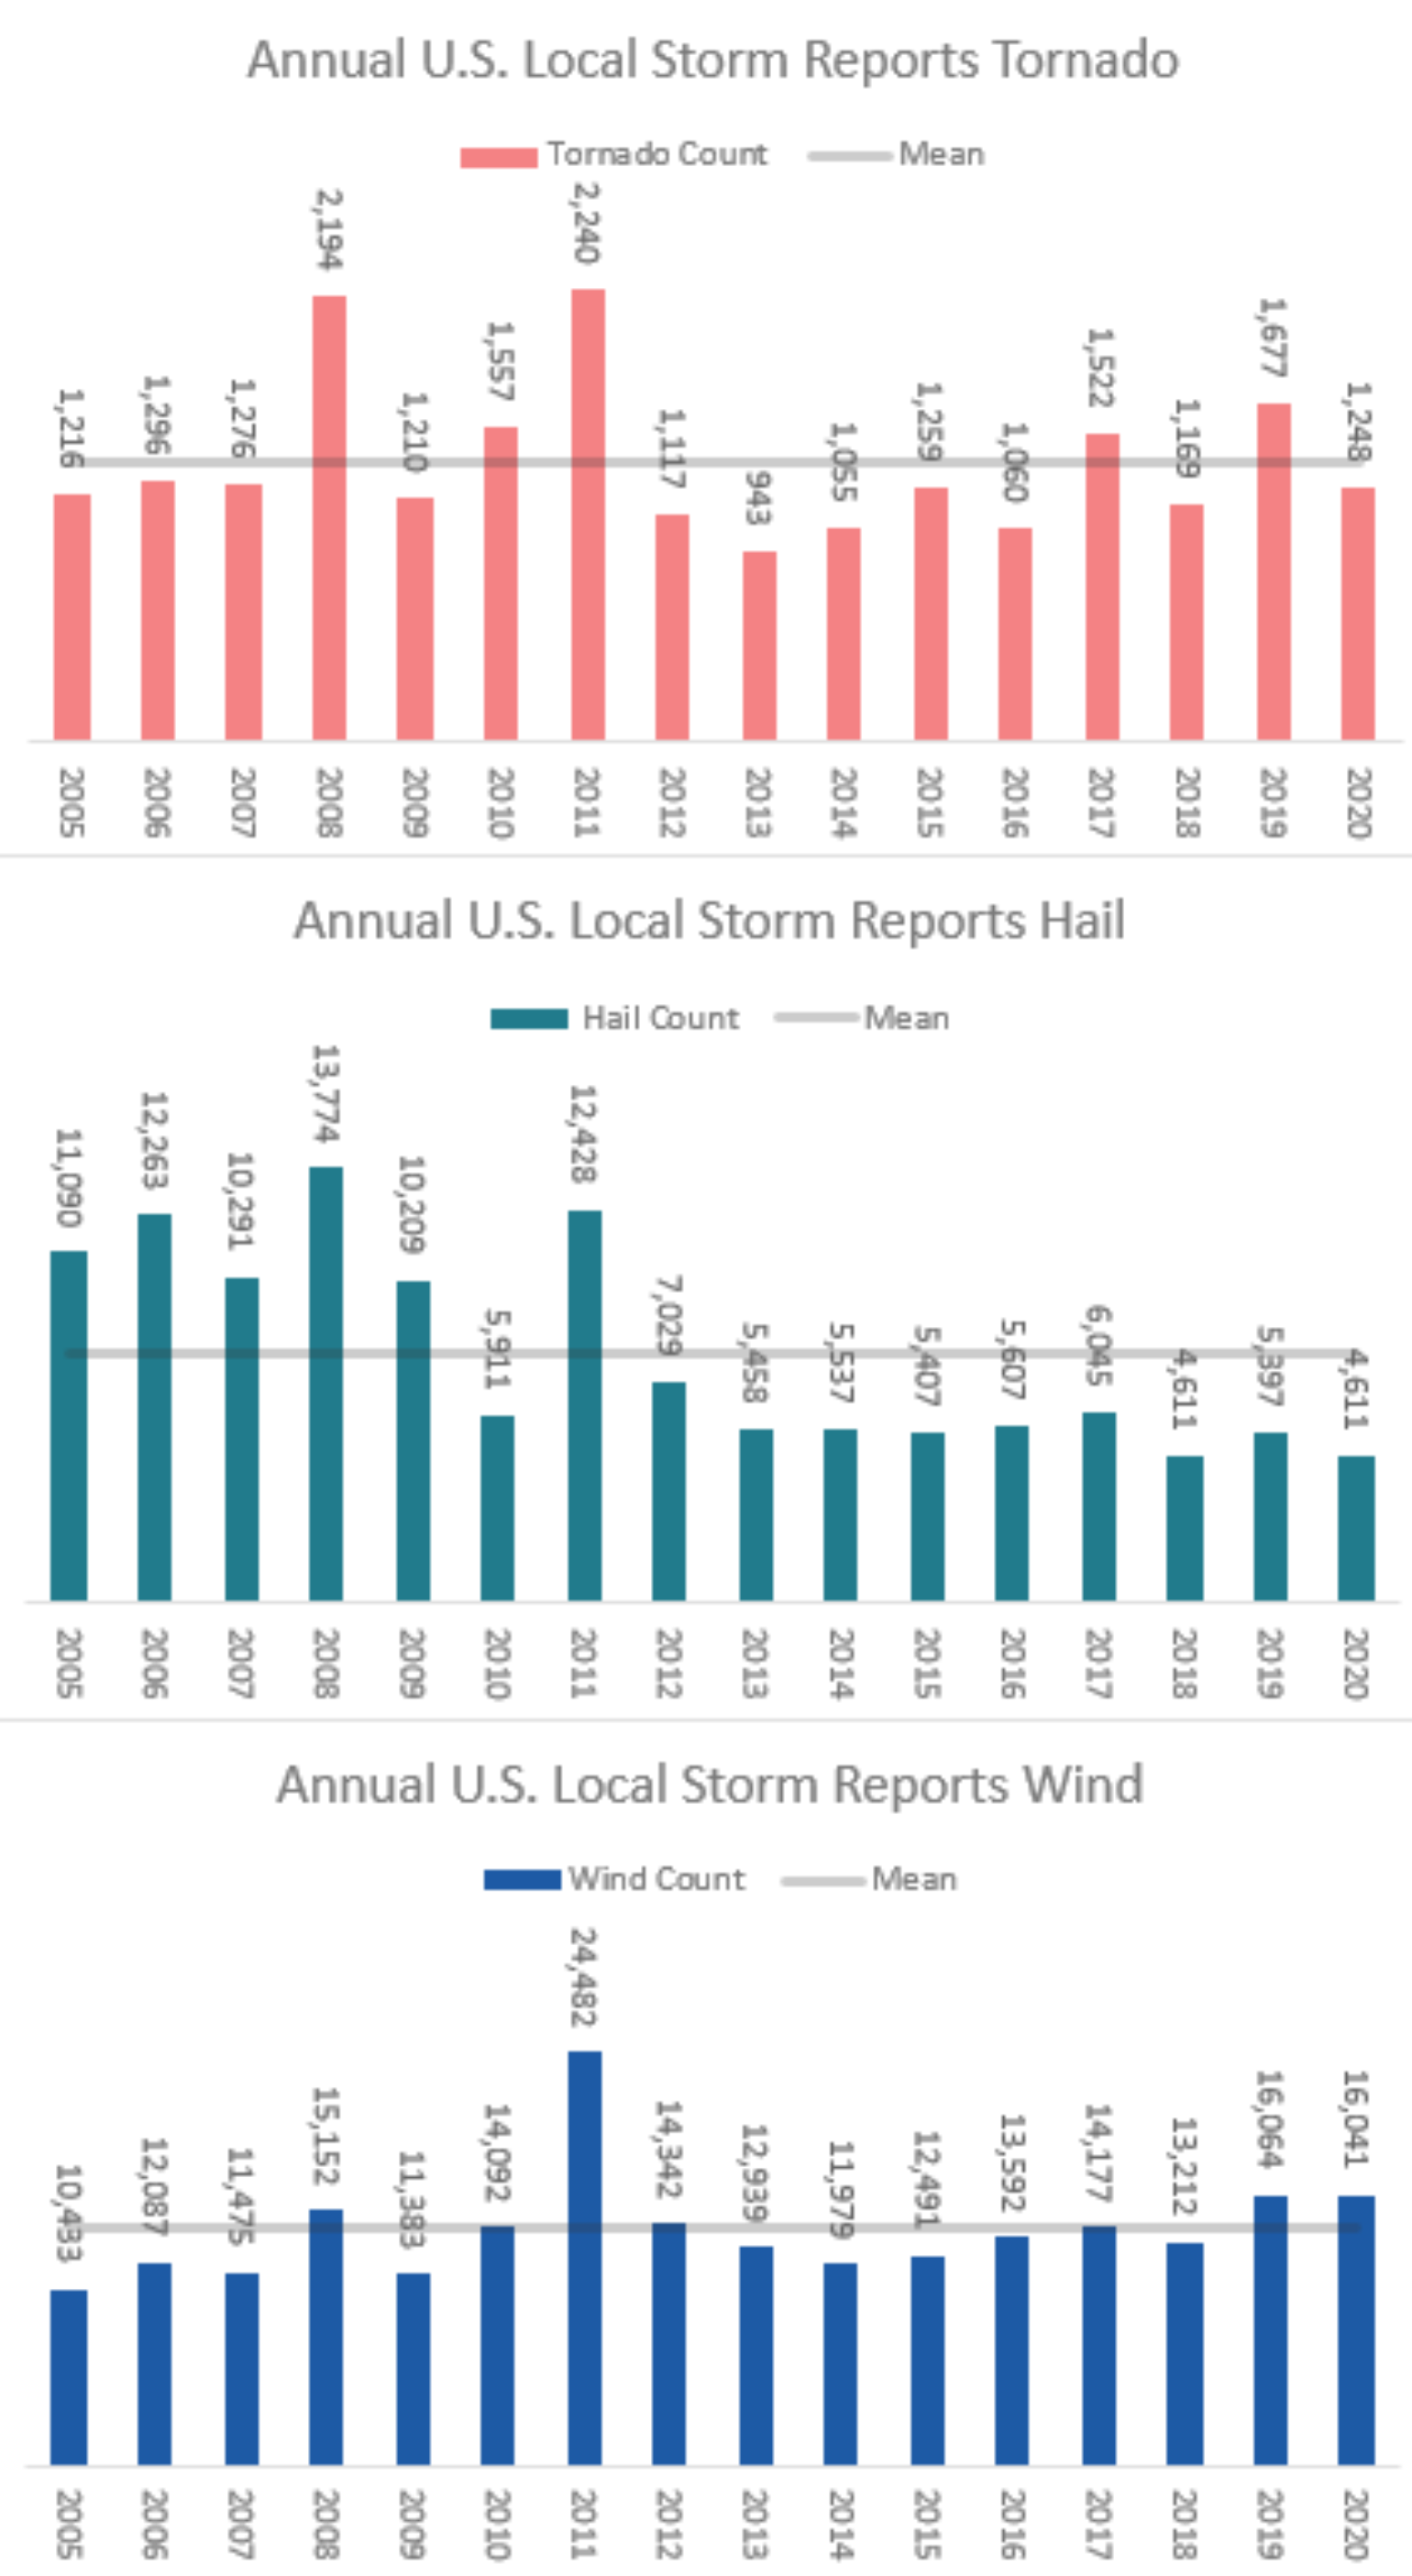
Various reports show that most of the largest and costliest natural disasters in 2020 occurred in the U.S. Severe weather in the U.S. led to over $30 billion in insured loss across 40 separate industry-wide events, according to Property Claims Services (PCS). But when you look at the severe weather data from 2020, it was not a record year. There is a disconnect between the observations of the peril of severe weather and the large amount of insured loss that occurred. For example, hail occurrences were the lowest since 2005, and, considering that an estimated 60% of annual storm losses in the U.S. result from hail, it would follow that most losses could have been driven from non-tornadic wind activity.
The Nashville tornado on March 2 once again proved that cities and expansive metropolitan areas are not shielded from large tornado impacts. However, as with hail, total tornado counts were observed just below the annual mean count. The U.S. currently is in the second-longest period between observations of EF5 tornadoes. The last EF5 tornado observed in the U.S. was on May 20, 2013. The other unusual aspect of the severe weather season was that Florida and Illinois each saw more tornadoes than Kansas and Oklahoma combined in 2020. Because tornadoes are correlated with outbreaks of other severe weather perils, maybe it was severe weather in the more populated Southeast that also contributed to the higher amounts in insurance loss this past year.
Not all severe thunderstorm wind impacts result from tornadoes. The Midwest derecho was by far the most significant event of 2020. It has been dubbed the equivalent to a major hurricane. Based on reports of high winds and wind damage, 2020 was on par with 2019 and overall the third-highest year of wind local storm reports since 2005. Therefore, maybe a higher percentage of insured losses are coming from severe wind events.
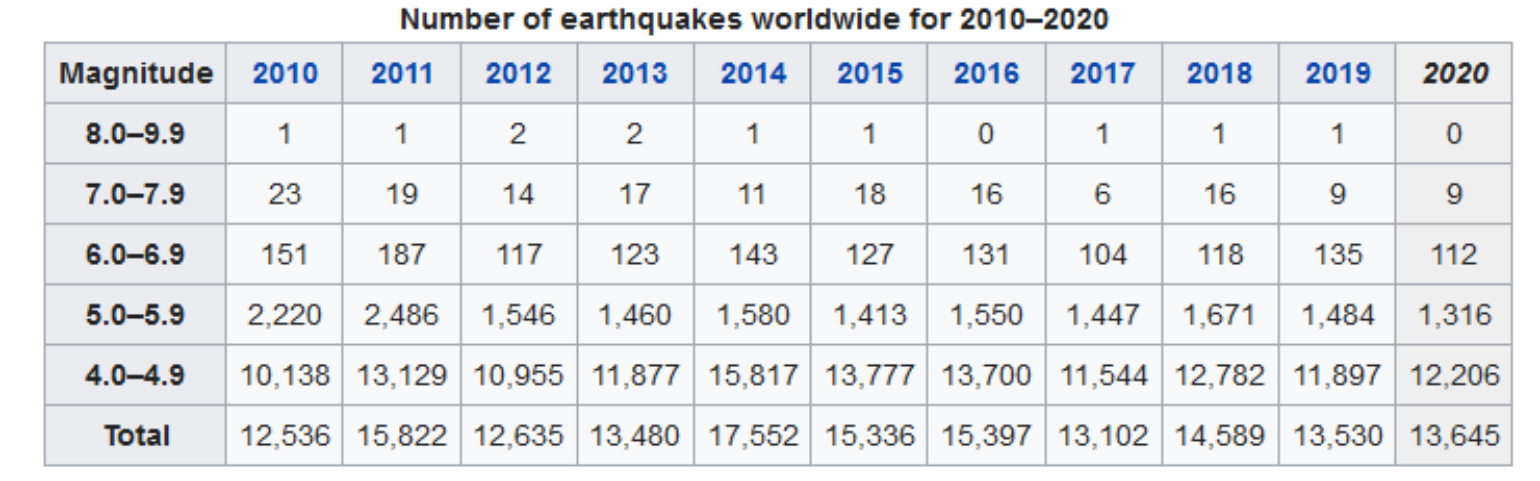
Few Major Earthquakes
2020 started with the most powerful earthquake to hit Puerto Rico since 1918, when a large Mw 6.4 earthquake struck just 5 miles off the southern coast on Jan. 7. Another rare earthquake struck about nine miles west of Salt Lake City as an Mw 5.7. Although the highest earthquake hazard in the continental U.S. is largely associated with California, which still awaits the big one, earthquakes in the past have been devastating. However, the 2020 global earthquake catalog was quite kind to the insurance industry, with the second year in a row with a relatively low number of Mw 7.0 or greater earthquakes from around the world.
Named Storm Activity
Many of the 2020 reviews have highlighted how active and devastating the 2020 Atlantic hurricane season was, in particular on the central Gulf Coast. This active landfall season had an impact on the total insured losses in the U.S., which currently accounts for just under $20 billion and should continue to develop as claims are still being processed. In the season-ending tropical update, it was noted that the clustering of storms was very evident this year. However, the insurance industry needs to understand that the hurricane magnet Florida was relatively unscathed during the active season and this is the 28th year that the very populated southeast Florida coastal city of Miami has not been hit by a major hurricane directly. Although Isaias had its impact widely felt in New England as it became an extratropical storm, this part of the U.S has not had any direct impacts from a hurricane since Bob in 1991. It has also been 31 years since the last major hurricane made landfall in South Carolina. The U.S. went 12 years without a major hurricane impact, and the landfall activity we are seeing over the last three years may just be nature's way of reverting landfall statistics to a Poisson distribution. Unfortunately, some areas are long overdue for a major hurricane landfall.
Spring 2021 Early Look Ahead
With half of the meteorological winter behind us, the early trends for spring show La Nina, which is known to cause stronger severe weather seasons in the U.S. La Nina is a cold phase of a large oscillation in the central Pacific Ocean, called ENSO, (El Nino Southern Oscillation). Preliminary data shows that the ENSO has already reached the peak of its cold phase. While it was not the strongest of all time, this La Nina was indeed quite strong, which increases the likelihood of its impact reaching into spring 2021.
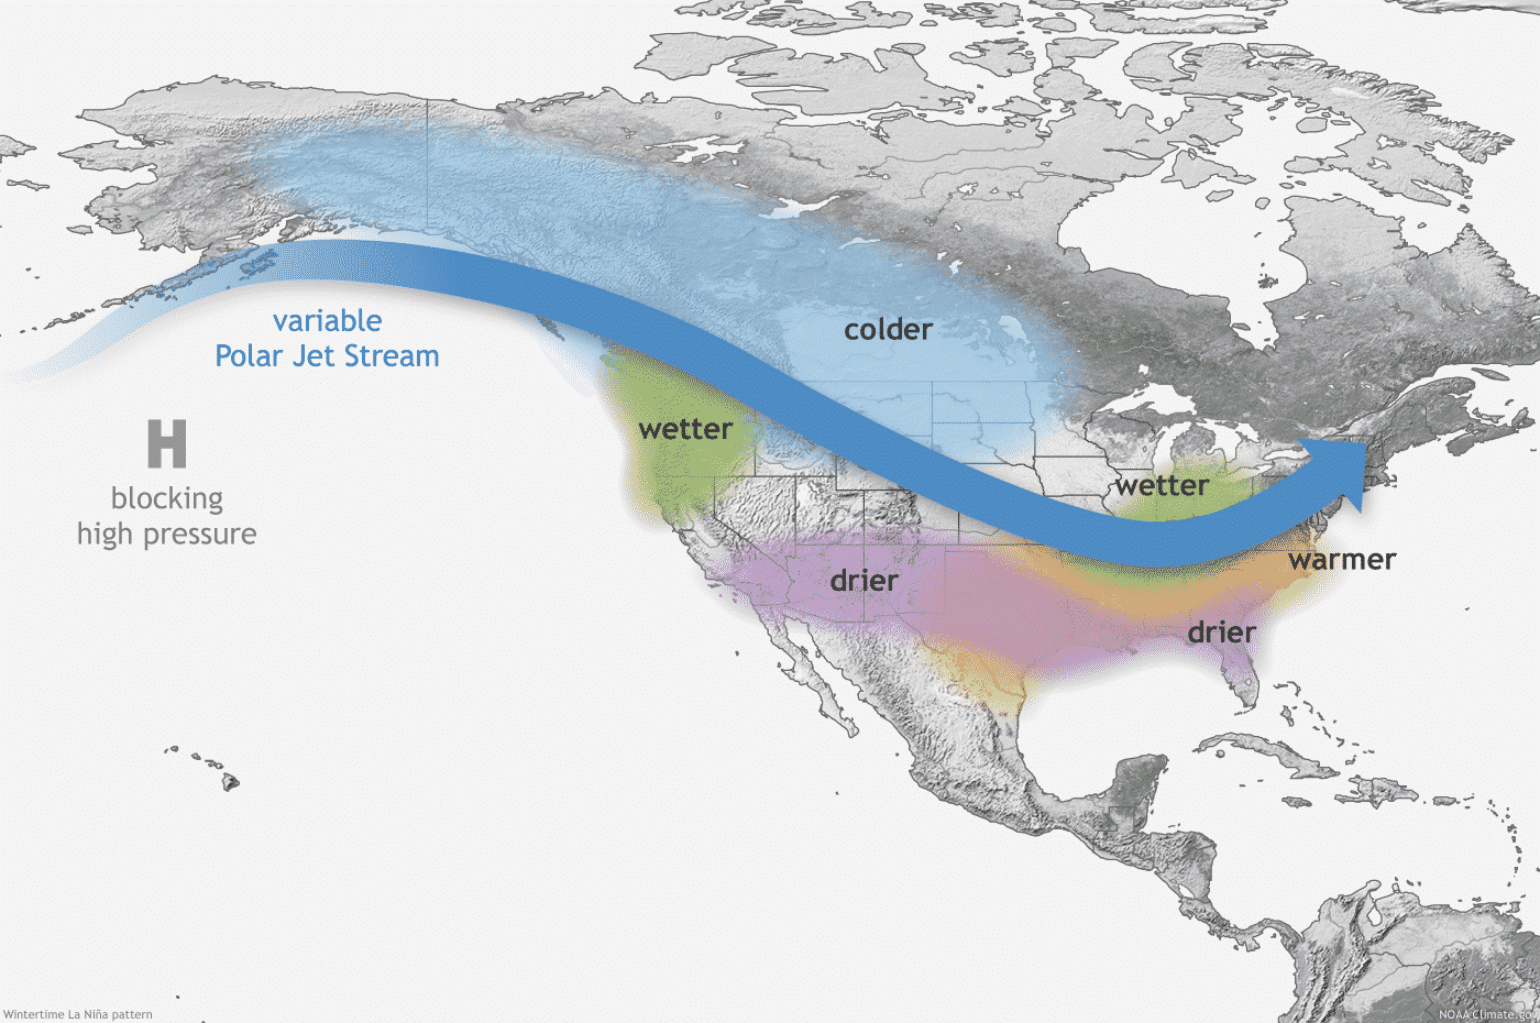
One of the main influences of La Nina (or any other ENSO phase) can be seen in the changing jet stream. The image below shows the average position of the jet stream during the La Nina seasons and the corresponding weather development over North America. The twisted jet stream brings colder air and storms down from Canada into northern and the north-western U.S., and warmer and drier weather to the southern parts.
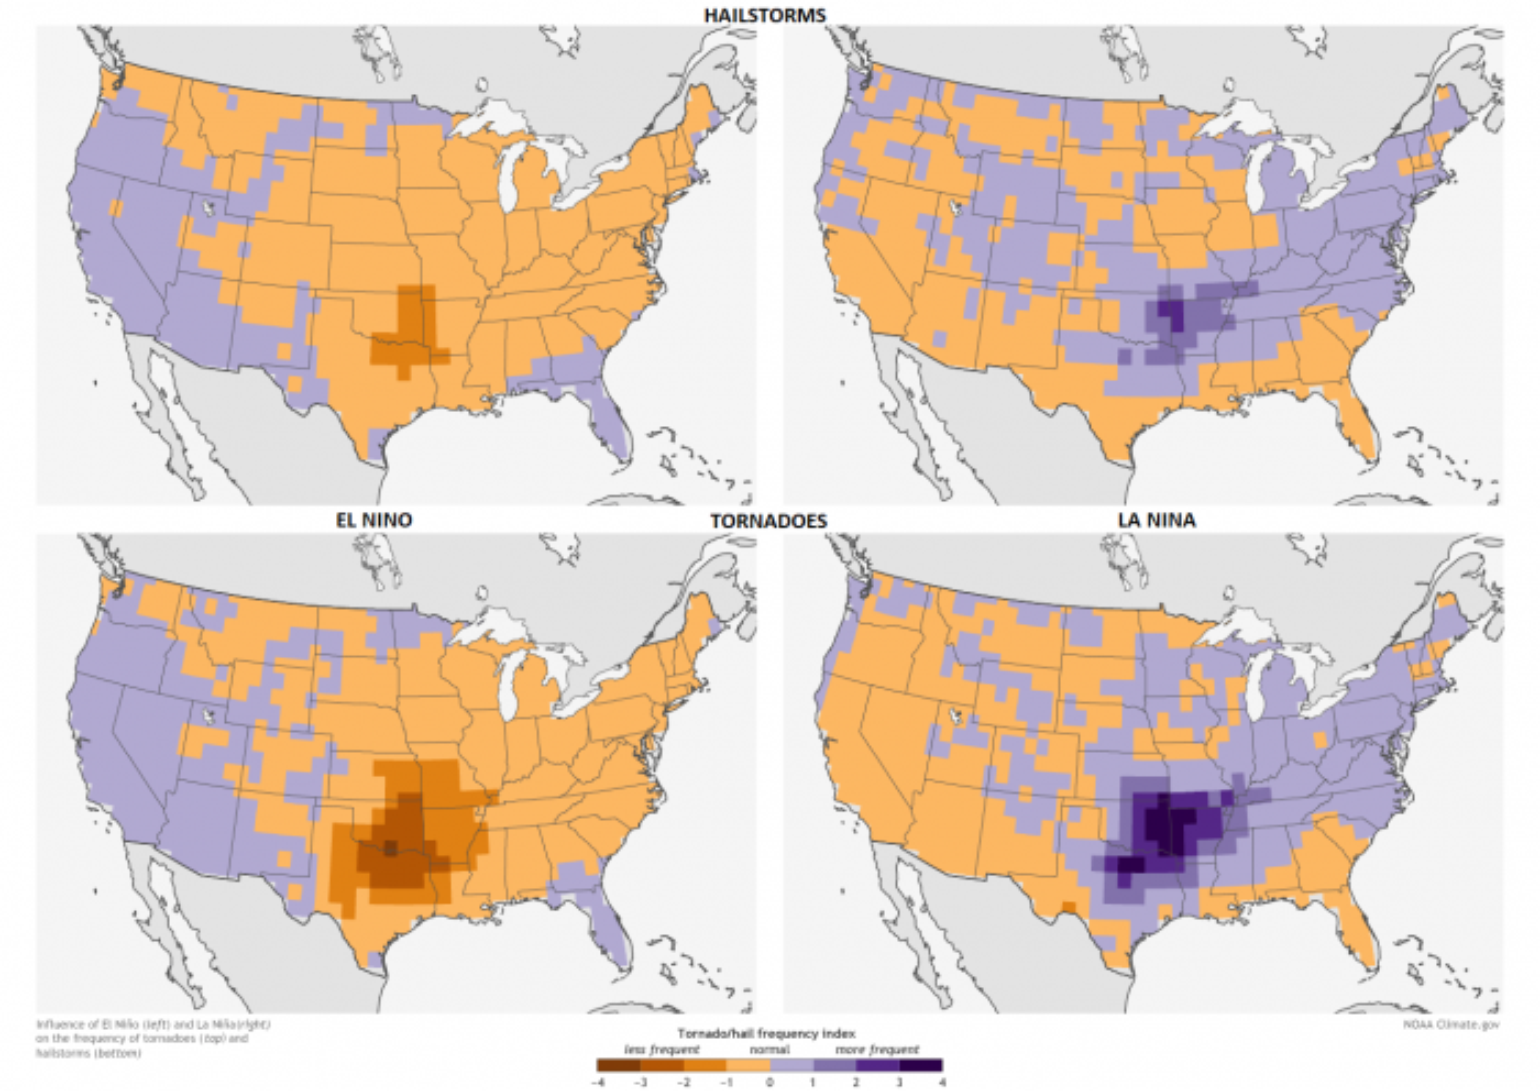
The image below shows a comparison of hailstorm and tornado frequency during the spring season in the U.S., between El Nino and La Nina years. In a La Nina spring season, there is a substantially higher frequency of hailstorms and especially tornadoes in the “Tornado Alley” south-central plains.
As La Nina promotes a high-pressure system in the North Pacific, there is usually a pressure drop over western Canada and the north-western U.S. Cold fronts often then move from western Canada down toward the south-central U.S., where they meet warm moist air coming from the Gulf of Mexico. With the jet stream altered by La Nina, the combination of conditions can create storms that become severe and tornadic.
See also: How to Minimize Flood Losses
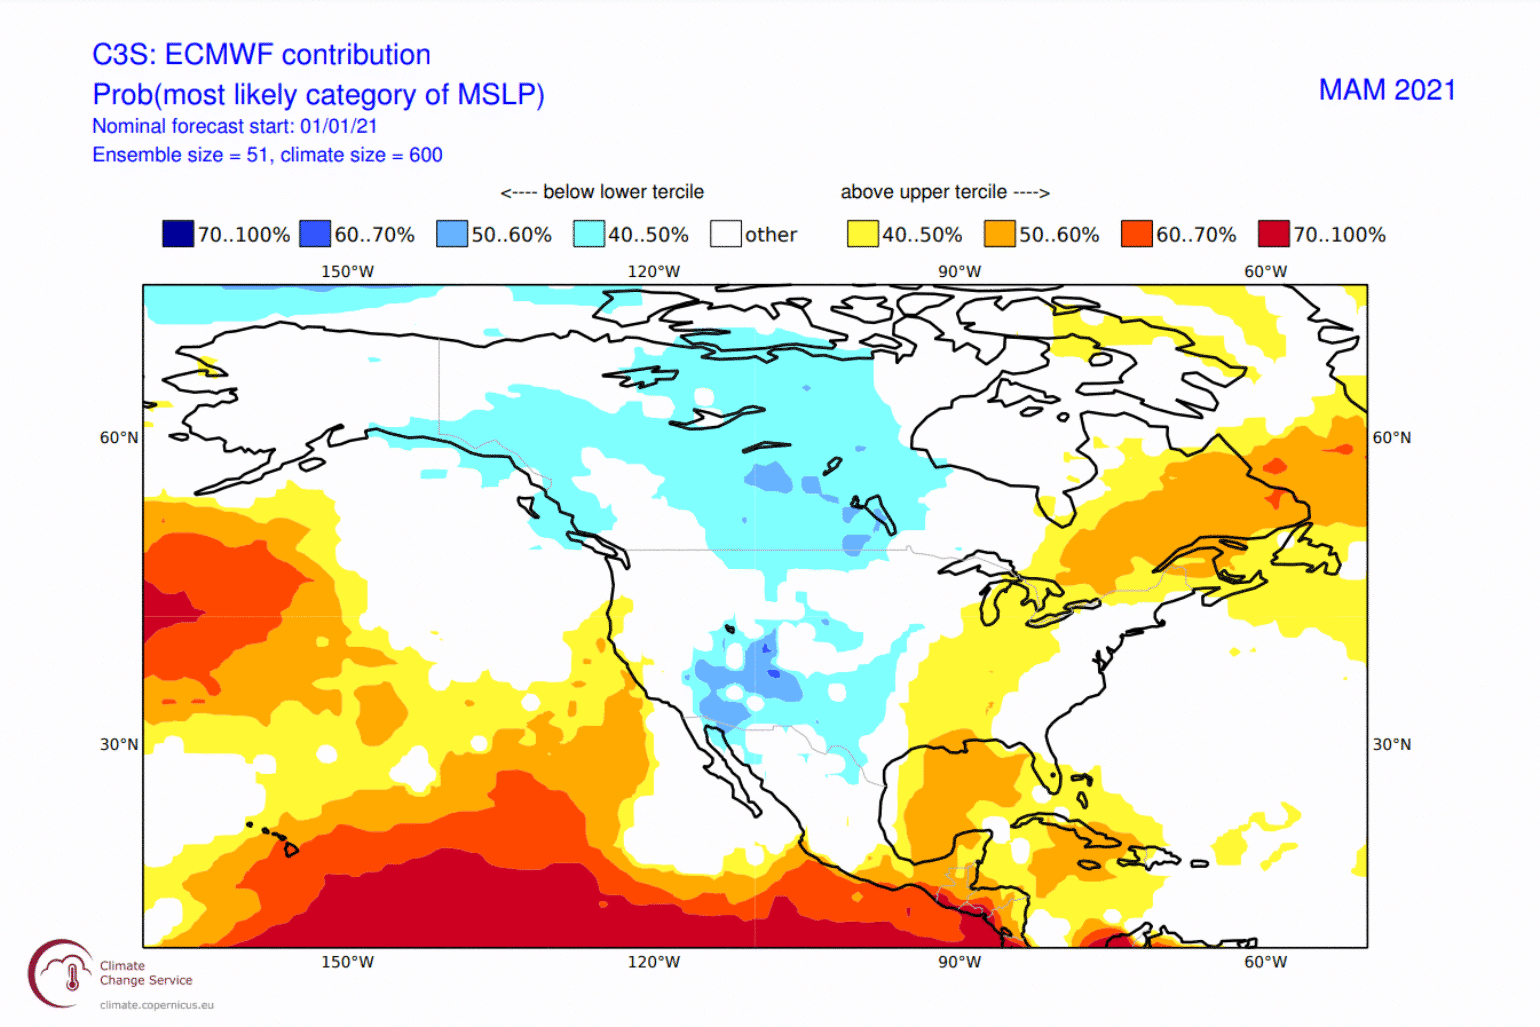
Below is the season forecast from the European Centre for Medium-Range Weather Forecasting (ECMWF) model. The forecast suggests the pressure forecast will be lower in western Canada, as well as in southern and southwestern U.S. This low-pressure zone means a stronger warm and moist southerly flow from the Gulf of Mexico into the south-central U.S., as a low-pressure system spins counterclockwise.
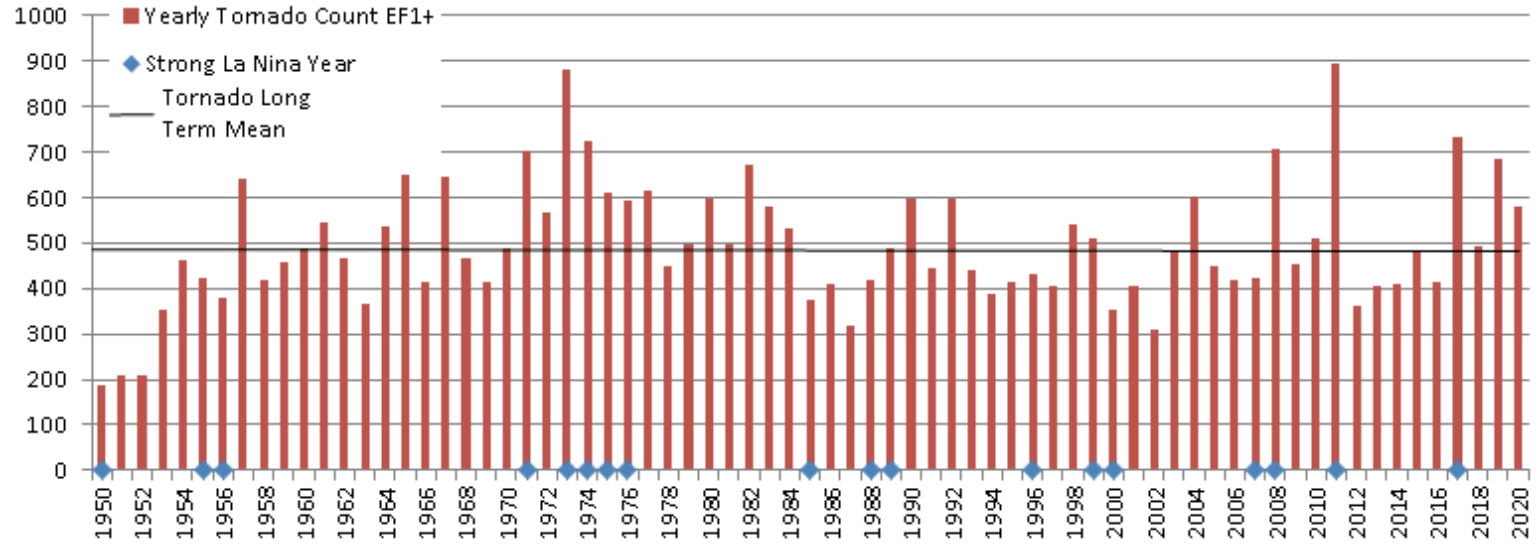
Below is a graph that shows annual tornado (EF1+) numbers in the U.S. from 1950 to 2020. We can see that many of the most active tornado years were La Nina years. If this spring La Nina holds together, given that it is the most active part of the year for tornadoes, and the occurrence of tornadoes is correlated with other forms of severe weather, there is a good chance the central plains could get back to seeing severe weather that was lacking last year. This is clearly something the BMS Analytics team will be watching and helping clients with, through tools like BMS IVision.