In a highly anticipated May 26 decision, the Connecticut Supreme Court ruled that two commercial general liability (CGL) insurers, Federal Insurance and Scottsdale Insurance, are not required to cover losses in connection with the mysterious disappearance of computer tapes containing employment-related data, including the Social Security numbers, of approximately 500,000 current and former IBM employees in
Recall Total Information Management, Inc. v. Federal Ins. Co.[1] Although the insurers in
Recall Total won this particular battle,
Recall Total’s value as precedent value as insurer-ammunition in their war against data breach coverage under CGL policies is severely limited by a highly unusual fact pattern.
Recall Total can reasonably be read to assist insureds facing more typical kinds of data breaches, like the Target breach and many others.
Below is a brief summary of the facts, the key coverage issue, the ruling and five takeaways.
The Facts
The facts of
Recall Total are unusual, to say the least: The computer tapes at issue, which belonged to IBM, fell off the back of a transportation subcontractor’s van near a highway exit ramp.
[2] About 130 of the tapes were then removed from the roadside by an unknown person and never recovered.
[3]
In the wake of this highway misadventure, IBM incurred more than $6 million in expenses to address the incident, including notification, call center services and credit monitoring.
[4] IBM sought indemnification from its vendor, Recall Total Information Management (Recall), which had contracted with IBM to transport off-site and store the computer tapes at issue.
[5] Recall settled with IBM and, in turn, sought indemnification from its transportation subcontractor, Executive Logistics (Ex Log), which lost the tapes after they fell off its van during transit. Ex Log agreed to pay more than $6.4 million to Recall and assigned to Recall its rights under a $2 million primary CGL policy and a $5 million umbrella policy following a coverage tender and denial.
[6] Ex Log and Recall then initiated coverage litigation.
[7]
Key Coverage Issue: Was There a “Publication”?
ExLog’s CGL policy at issue, similar to the current ISO standard form CGL policy,
[8] states in relevant part that the insurer “will pay damages that the insured becomes legally obligated to pay … for … personal injury.”
[9] The policy defines the key term “personal injury” to include “injury … caused by an offense of ... electronic, oral, written or other
publication of material that ... violates a person’s right to privacy.”
[10]
The Ruling
The intermediate appellate court, in a decision adopted by the Connecticut Supreme Court, appeared ready to find, or at least was not averse to finding, “publication” satisfied if there was any evidence of access to the data. Based upon the unique facts, however, the intermediate appellate court determined that the “publication” requirement was not satisfied because there was no evidence that the data on the tapes, which could not be read by a personal computer, “was ever accessed by anyone”
[11] -- let alone used it for “any improper purpose.”
[12]
As the intermediate appellate court stated, there was not even any evidence that the party who took the tapes “
even recognized that the tapes contained personal information.”
[13] Under these unique facts, and the fact that no IBM employee had suffered any injury, the court determined that it was “unable to infer that there has been a publication” and concluded that “[a]s the complaint and affidavits are
entirely devoid of facts suggesting that the personal information actually was accessed, there has been no publication.”
[14]
In a brief per curiam opinion, the Connecticut Supreme Court affirmed on the basis that there was no “publication,” noting that “[t]here is no evidence that anyone ever accessed the information on the tapes or that their loss caused injury to any IBM employee.”
[15]
Takeaways
- The “Access” Lacking in Recall Total Is Present in Many Data Breach Cases
Recall Total is of limited utility to insurers seeking to avoid CGL coverage for data breaches given its peculiar factual setting. As the decision makes abundantly clear, it hinged on the fact that there was no evidence of access to the sensitive data. In fact, there was no evidence that the data
could be accessed -- or even that the party who took the tapes was aware that they contained sensitive data. This is in stark contrast to a typical data breach fact pattern, in which there is no question that sensitive information was accessed. In breaches like Target, and innumerable others, information is specifically identified and targeted by the actors taking it, and then used for criminal activity. In those cases, there is abundant evidence that the data in question was accessed.
- Other Courts Have Found the CGL “Publication” Requirement Satisfied Without Proof of “Access” in the Data Breach Context
Although “access” to data may be required under Connecticut law, courts in other jurisdictions have appropriately determined that the CGL “publication” requirement can be satisfied without proof that data was accessed. In one recent case involving the alleged posting of confidential medical records on the Internet, for example, the Eastern District of Virginia determined that “publication” does not require proof of “access”: [T]he issue is not whether a third party accessed the information because
the definition of “publication” does not hinge on third-party access. Publication occurs when information is “placed before the public,” not when a member of the public reads the information placed before it. By Travelers’ logic, a book that is bound and placed on the shelves of Barnes & Noble is not “published” until a customer takes the book off the shelf and reads it.
[16]
The bottom line: access to data storage devices alone, including laptops, may suffice to satisfy the “publication” requirement in other jurisdictions -- and even in Connecticut under a different set of facts.
- Insureds Must Be Prepared to Fight to Secure CGL Coverage
The insurance industry has made it abundantly clear that it does not want to cover “cyber” and data privacy related exposures under CGL policies. Although there is potential valuable coverage under CGL policies, insureds should expect that they will need to fight to secure it. Insurers routinely assert, among other things, that there has been no “publication” of data. The good news is that if insureds decide to fight for coverage, they may well prevail. Many courts have upheld coverage for data breaches and other claims alleging violations of privacy rights in a variety of settings.
[17]
- Insureds Should Be Aware of New CGL “Data Breach” Exclusions
Insurance Services Office (ISO), the insurance organization responsible for drafting standard-form CGL language, recently promulgated a series of data breach exclusionary endorsements.
[18] The exclusions became effective in most states in May 2014 and began appearing on new placements and renewals, in various forms, almost immediately.
[19] Although it is important to be aware of new, potentially limiting, coverage terms, it also is important to recognize that the applicable policy in a data breach situation -- where breaches often are discovered long after the “occurrence” that triggers coverage -- may predate the newer exclusions. Where policies do contain the newer exclusions, insureds should not assume that they necessarily void coverage. Coverage will depend on myriad factors, including the particular facts of the case, specific policy language and applicable law.
The very existence of the exclusions, moreover, illustrates the insurance industry’s awareness that there is valuable potential data breach coverage under CGL policies. Indeed, when ISO filed the newer exclusions, it acknowledged that there currently may be data breach coverage for data breaches under CGL policies and advised that the new exclusions may be a “reduction in personal and advertising injury coverage”: "At the time the ISO CGL and CLU policies were developed, certain hacking activities or data breaches were not prevalent, and, therefore, coverages related to the access to or disclosure of personal or confidential information and associated with such events were not necessarily contemplated under the policy. As the exposures to data breaches increased over time, stand-alone policies started to become available in the marketplace to provide certain coverage with respect to data breach and access to or disclosure of confidential or personal information. . . . To the extent that any access or disclosure of confidential or personal information results in an oral or written publication that violates a person’s right of privacy, this revision may be considered a reduction in personal and advertising injury coverage.
[20] "
The implication is that the insurance industry understood there was CGL data breach coverage in the absence of the new exclusions.
- Organizations Are Advised to Consider Cyber Insurance
Given the insurance industry’s clear indication that it does not want to cover data breaches under CGL policies, organizations are advised to consider purchasing cyber insurance. In addition to providing defense and indemnity coverage in connection with claims arising out of a data breach, among many other types of cybersecurity and data privacy-related exposures, cyber policies generally cover a range of “crisis management” expenses, such as attorney “breach coach” fees, notification to potentially affected individuals, forensics, credit monitoring, call centers, ID theft protection and public relations efforts, which often are required after a breach of any consequence.
Cyber insurance coverage can be extremely valuable, but choosing the right insurance policy presents a real and significant challenge. There is a diverse and growing array of cyber products in the marketplace, each with its own insurer-drafted terms and conditions that vary dramatically from insurer to insurer—and even between policies underwritten by the same insurer. Because of the nature of the cyber insurance and the risks that it is intended to cover, a placement should include the involvement and input, not only of a capable risk management department and a knowledgeable insurance broker, but also of in-house legal counsel, information technology professionals and compliance personnel, among other key internal players -- and insurance coverage counsel well-versed in this challenging and dynamic line of coverage.
[1] --- A.3d ----, 2015 WL 2371957 (Conn. May 26, 2015),
aff’g 83 A.3d 664 (Conn. App. Ct. 2014).
[2] Recall Total, 83 A.3d at 667.
[3] Id.
[4] Id. at 668.
[5] Id.
[6] Id.
[7] Id.
[8] The current standard industry form states that the insurer “will pay those sums that the insured becomes legally obligated to pay as damages because of ‘personal and advertising injury,’” which is defined to include “[o]ral or written publication, in any manner, of material that violates a person’s right of privacy.” ISO Form CG 00 01 04 13 (2012), Section I, Coverage B, §1.a., §14.e.
[9] Recall Total, 83 A.3d at 672.
[10] Id.
[11] Id. at 673.
[12] Id.
[13] Id. at n.9 (emphasis added).
[14] Id. at 672 (emphasis added).
[15] Recall Total, 2015 WL 2371957, at *1.
[16] Travelers Indem. Co. of America v. Portal Healthcare Solutions, LLC, 35 F.Supp.3d 765, 771 (2014).
[17] See, e.g., Hartford Cas. Ins. Co. v. Corcino & Assocs,. 2013 WL 5687527, at *2 (C.D. Cal. Oct. 7, 2013) (upholding coverage in a data breach case for statutory damages of $1,000 per person under the CMIA and statutory damages of as much as $10,000 per person under the California Lanterman-Petris-Short Act under a policy that covered damages that the insured was “legally obligated to pay as damages because of ... electronic publication of material that violates a person’s right of privacy”).
[18] One of the exclusionary endorsements, entitled “Exclusion - Access Or Disclosure Of Confidential Or Personal Information,” adds the following exclusion to the standard form CGL primary policy:
This insurance does not apply to:
Access Or Disclosure Of Confidential Or Personal Information
“Personal and advertising injury” arising out of any access to or disclosure of any person’s or organization’s confidential or personal information, including patents, trade secrets, processing methods, customer lists, financial information, credit card information, health information or any other type of non public information.
This exclusion applies even if damages are claimed for notification costs, credit monitoring expenses, forensic expenses, public relations expenses or any other loss, cost or expense incurred by you or others arising out of any access to or disclosure of any person’s or organization’s confidential or personal information.
CG 21 08 05 14 (2013).
[19] See Roberta Anderson, “
Coming To A CGL Policy Near You: Data Breach Exclusions,”
Law360, April 23, 2014.
[20] ISO Commercial Lines Forms Filing CL-2013-0DBFR, at pp. 3, 7-8 (emphasis added).


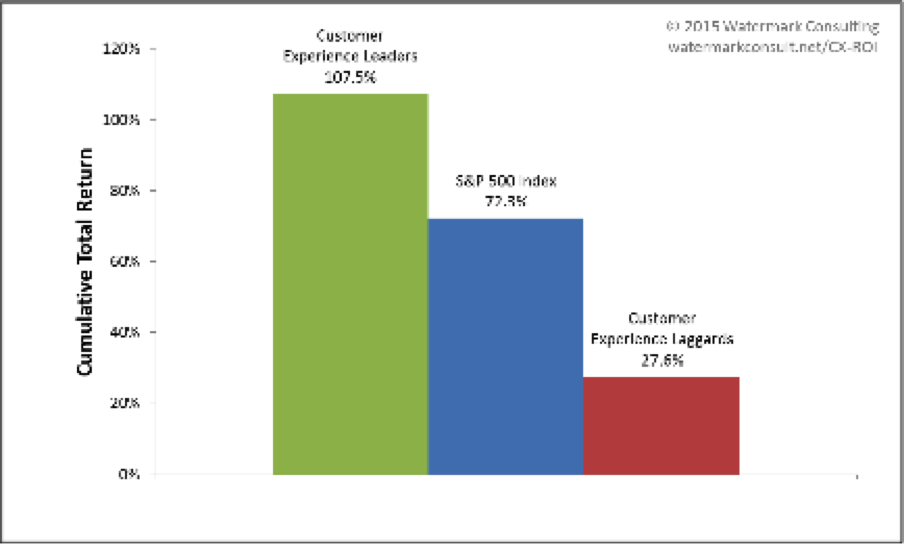 Comparison is based on performance of equally weighted, annually readjusted stock portfolios of Customer Experience Leaders and Laggards relative to the S&P 500 Index. Leaders outperformed the broader market, generating a total return that was 35 points higher than the S&P 500 Index. Laggards trailed far behind, posting a total return that was 45 points lower than that of the broader market.