
You've heard it before, "It's not the tip of the iceberg that cost you so much; it's what you can't see. It’s what's below the water level that costs you real money." We hear that the total loss to a company from a workers’ comp loss is six to 10 times the value of that work comp loss. But risk managers have neither the right tools to understand and measure the loss, nor the right tools to improve productivity to capture the cash flow that comes from preventing that loss.
During my initial journey into lean sigma consulting, a seasoned Japanese colleague shared an important concept. While this principle was developed to improve the quality and efficiency of output in manufacturing, it has many other applications, including in improving safety and reducing workers’ comp costs. Understanding and applying the rule has improved the profitability of many companies.
Dr. Genichi Taguchi, a Japanese engineer, theorized (and ultimately proved mathematically) that loss within any process or system develops exponentially–not linearly--as we move away from the ideal customer specification or target value.
An example of Taguchi's Loss Curve is shown below:
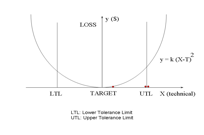 Another way to look at it is this: Anything delivered just outside the target, (labeled as LTL and UTL in the diagram above) creates opportunity for exponential financial improvement as we move toward the center of the U-shaped curve. And the farther away from the target we are, the greater the opportunity.
I explain Taguchi's principle using an example from a kaizen event that dramatically improved machine setup times within a CNC shop.
For years, our client assumed it took 46 minutes to set up and change over machinery. After all, for 10 years, it did take 46 minutes. But our kaizen team was hired to challenge this thinking.
If the CEO and his team were right, setup times couldn't be completed any faster. But if setup times could be better, loss had been occurring beneath the water line, which meant the iceberg was growing, but no one knew.
Machine setup time is loss because no value is produced during the setup process. And setup times can represent 35% of the total labor burden, so there's a lot at stake. While employers can compute labor and overhead costs easily, when their assumptions are incorrect about setup times, they're losing big money. But rarely do they know it or how much.
Here's our client’s story:
Our client used people and machinery to produce aircraft parts. Machines were not dedicated to product families or cycle times. In other words, the client could build a Mack Truck or Toyota Corolla on the same machinery. And because setup times were slow, the client built large batches of products. When defects struck, they struck in large quantities, and, financially, it was too late to find causes. The costs were already sunk.
Our client borrowed capital to purchase nine machines, leased the appropriate space to house them and purchased electricity, water, and cutting fluids, as well. Each machine had affiliated tool and dies, and mechanics to service them. In other words, when you own nine machines, you need the gear, people and money required to operate and maintain nine machines. And all of this cost was based on 46-minute setups.
Think about that for a moment.
If the client didn't need nine machines, it wouldn't have had to spend all of that money and for all of those years! And a wrong assumption in setup times could be leading to loss that never appeared on any income statement. What would show would be the known labor, materials, machinery and overhead costs. But what wouldn't show would be what wasn't needed if the team could complete a setup in less than 46 minutes.
After videotaping, collaborating and measuring cycle times on the existing operations and processes, it was evident: The team had ideas that would challenge the 46-minute setups.
After some 5S housekeeping, the team produced a 23-minute setup. One more day of tweaking, and the team got it down to 16. By the last day, the team was consistently producing 10-minute results.
Now let's talk about the impact.
Under the better state, the client could indeed produce parts faster. It also needed far less capital, insurance, labor, gear, electricity, fluids, tooling, floor space, etc. And because our client's customer would now get parts faster, the company would get paid faster.
While banks may not like these facts, clients and employees do. Employees can do their jobs more efficiently, and the company makes more money while borrowing less.
Here's an explanation of the 5S tool the team used to make their setup times faster. This tool–when used properly––not only improves operating efficiency but removes or reduces safety hazards like: tripping, standing, walking, reaching, handling, lifting and searching for lost items.
In addition, the kaizen event itself creates an opportunity for employees to improve their own job conditions and use their curiosity and creativity to solve production-related problems. The event also creates a more engaged employee, one less likely to file future work comp and employment-related claims.
The 5S Process consists of five steps.
Another way to look at it is this: Anything delivered just outside the target, (labeled as LTL and UTL in the diagram above) creates opportunity for exponential financial improvement as we move toward the center of the U-shaped curve. And the farther away from the target we are, the greater the opportunity.
I explain Taguchi's principle using an example from a kaizen event that dramatically improved machine setup times within a CNC shop.
For years, our client assumed it took 46 minutes to set up and change over machinery. After all, for 10 years, it did take 46 minutes. But our kaizen team was hired to challenge this thinking.
If the CEO and his team were right, setup times couldn't be completed any faster. But if setup times could be better, loss had been occurring beneath the water line, which meant the iceberg was growing, but no one knew.
Machine setup time is loss because no value is produced during the setup process. And setup times can represent 35% of the total labor burden, so there's a lot at stake. While employers can compute labor and overhead costs easily, when their assumptions are incorrect about setup times, they're losing big money. But rarely do they know it or how much.
Here's our client’s story:
Our client used people and machinery to produce aircraft parts. Machines were not dedicated to product families or cycle times. In other words, the client could build a Mack Truck or Toyota Corolla on the same machinery. And because setup times were slow, the client built large batches of products. When defects struck, they struck in large quantities, and, financially, it was too late to find causes. The costs were already sunk.
Our client borrowed capital to purchase nine machines, leased the appropriate space to house them and purchased electricity, water, and cutting fluids, as well. Each machine had affiliated tool and dies, and mechanics to service them. In other words, when you own nine machines, you need the gear, people and money required to operate and maintain nine machines. And all of this cost was based on 46-minute setups.
Think about that for a moment.
If the client didn't need nine machines, it wouldn't have had to spend all of that money and for all of those years! And a wrong assumption in setup times could be leading to loss that never appeared on any income statement. What would show would be the known labor, materials, machinery and overhead costs. But what wouldn't show would be what wasn't needed if the team could complete a setup in less than 46 minutes.
After videotaping, collaborating and measuring cycle times on the existing operations and processes, it was evident: The team had ideas that would challenge the 46-minute setups.
After some 5S housekeeping, the team produced a 23-minute setup. One more day of tweaking, and the team got it down to 16. By the last day, the team was consistently producing 10-minute results.
Now let's talk about the impact.
Under the better state, the client could indeed produce parts faster. It also needed far less capital, insurance, labor, gear, electricity, fluids, tooling, floor space, etc. And because our client's customer would now get parts faster, the company would get paid faster.
While banks may not like these facts, clients and employees do. Employees can do their jobs more efficiently, and the company makes more money while borrowing less.
Here's an explanation of the 5S tool the team used to make their setup times faster. This tool–when used properly––not only improves operating efficiency but removes or reduces safety hazards like: tripping, standing, walking, reaching, handling, lifting and searching for lost items.
In addition, the kaizen event itself creates an opportunity for employees to improve their own job conditions and use their curiosity and creativity to solve production-related problems. The event also creates a more engaged employee, one less likely to file future work comp and employment-related claims.
The 5S Process consists of five steps.
- Sort the work area out.
- Straighten the work area out, putting everything in the right place.
- Clean the entire area, scrub floors, create aisle ways with yellow tape, wash walls, paint, etc.
- Create standardized, written work processes.
- Sustain the process
- They need to have something to motivate them––which often means facing a crisis.
- They need to physically see and experience things to believe them.