
Introduction
Unclosed business (premium) refers to the premium income from insurance policies that are yet to be processed, but for which the entity is liable at the valuation date. Because the insurer is liable for all unexpired risks irrespective of whether premium has been received, it needs to be stated in accordance with the standards set out for the unclosed business.
Unclosed business, also called "pipeline premium," can be a significant component of unearned premiums at the balance date. The materiality depends on the distribution channels, such that, if the proportion of business written by brokers and agents were high, the unclosed business would be higher given that brokers can retain premium for up to 90 days after the policy inception date. Broadly, unclosed business can be broken down into these components:
- New business that has been written but not processed
- Renewals with a date of attachment before the balance date that have neither been paid nor canceled
- Broker business, where latest information about policies written has not been provided
- Any others, in situations that lead to non-receivable payments by the company
Most of the actuarial literature gives little attention to models for estimation of premium liabilities. Usually the approach for estimation of unclosed business entails application of chain ladder and methods such as 12-month rolling averages, proportion of premium closed at the end of six months. However, given the lumpy and seasonal nature of unclosed business, some issues can arise with these approaches:
- Methodology: Most often, methodology for estimation of unclosed premium is inconsistent and unstandardized across business units (BUs). BUs deploy different assumptions to calculate unclosed premium amount.
- Process efficiency: Process may be inefficient owing to multiple manual interventions in preparing the final numbers. There could be involvement of multiple people, leading to delays due to lack of coordination and availability.
- Accuracy: The estimated numbers suffer from low accuracy.
Given that there is regulatory requirement to report unclosed business, this article presents an actuarial model to estimate unclosed business on a monthly basis overcoming the issues highlighted above.
A Novel Approach for Calculating Unclosed Premium
A new modeling approach was developed with one of the insurance carriers across 10 different business units having 40-plus reporting segments. The data at a policy X term level was requested to start building the actuarial model. Though the model was built at the BU level with aggregated data, it was important to use the policy level details first and then roll up the data to the desired level. Over five years policy level data was received in Excel files, spread over five spreadsheets covering 10 BUs.
Data Processing:
Data processing is a crucial component of model building, so a thorough approach was undertaken to ensure the robustness of the model. The following data sanitization techniques were performed:
- Data Quality Assessment — The trends in the data were screened to rule out missing or inconsistent information that could potentially distort the model results. It was observed that for a particular business unit, an erroneous value was present in the data, and the same was highlighted to the client to confirm the veracity of that data point.
- Data Gap Assessment — The data requirements were shared with the carrier. Data for some BUs was not complete, and these gaps were called out to the carrier.
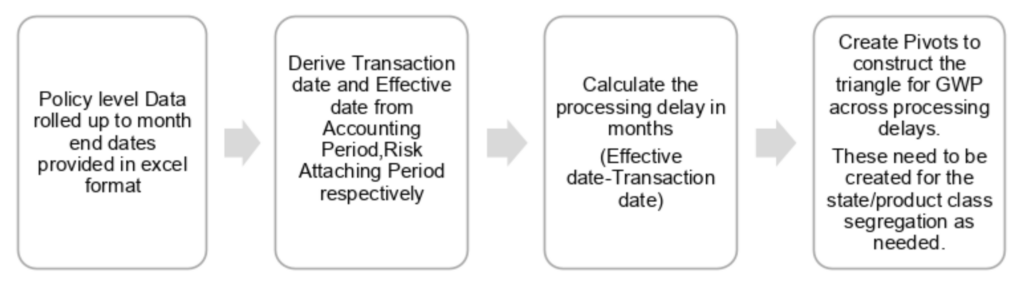
- Data Modification — This entailed changing the formats, as some fields were text. Furthermore, a new field "delay" was imputed, to factor in the processing delay pattern (in months). This was used to prepare the closed gross written premium (GWP) triangle by processing delays over the policy effective months.
For the purpose of a standardized model, a single consolidated source of data was used, and the following data preparation steps were followed:
Figure 1: Data Preparation Steps
Model Methodology
It was observed from the data that, for most BUs, 90% of the unclosed premium processed within eight months. An assumption was made for the model, that the GWP processes fully within 12 months for any given BU. Given the variability of data across BUs, automating the estimate generation process with a high degree of accuracy allowed for moving beyond point estimation. The model that was finally deployed used a simplified GLM framework, calculating the development in GWP through the chain ladder, volume-weighted, age-to-age ratios and assuming Poisson residuals. Becausee the method used bootstrap simulation, it yielded a distribution around the estimates, giving more information about the results.
The figure below pictorially depicts the model methodology
Figure 2: Bootstrap Chain Ladder Methodology
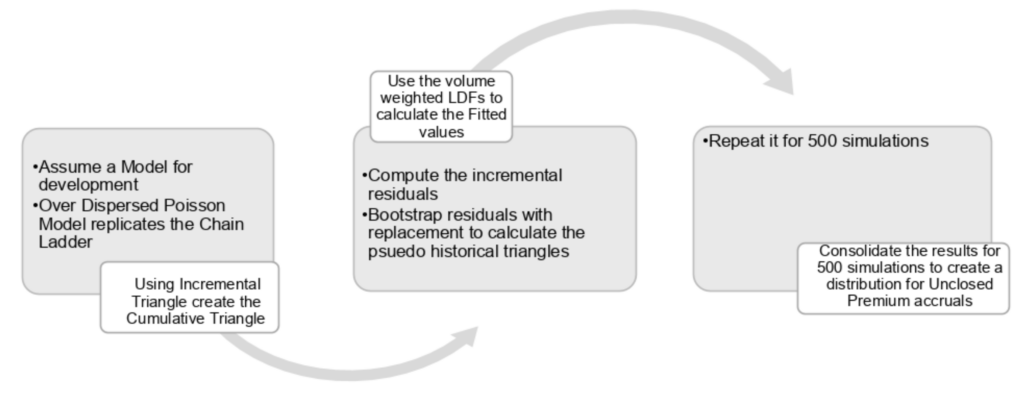
The pivot triangles created as detailed in the section were an input to the model. Using the cumulative triangle for GWP and the volume-weighted, age-to-age factors, fitted values were calculated.
See also: NPS Scores Provide 3 Keys to Growth
Model Output
In each simulation, using selected development factors, basis the trend in the pseudo-generated triangle, estimated an unclosed premium accrual figure. The 500 simulations permit the model to pick different trends that may have occurred in the past, and each unclosed figure generated is thus an estimate with a certain probability. Ideally, 10,000 simulations are sufficient to approximate the theoretical distribution as in Monte Carlo simulations. However, the mean and median results of the model varied by less than 1%, and, thus, 500 simulations stood a good approximation, given the constraints imposed by Excel. The trends in data can be quite volatile to estimate a single number with reasonable accuracy in an automated model; thus, we produced a distribution for unclosed business.
The results generated include the mean, 50th, 75th and 95th percentiles to cater to all scenarios possible. The 50th percentile closely resembles the mean value, as 500 simulations will normalize the distribution. The 95th percentile can be interpreted as the tail value in the distribution and less likely to occur but still can occur with non-zero probability (basis the peak in data fed in the model).
Automation & Standardization
To improve the process efficiency, the steps were automated through VBA macros to make the whole modeling process seamless. A single person can run the model, with minimal need for training. With few user inputs like the model month and location details to store the results, the macros cater to these tasks:
- Data preparation steps
- Creating empty workbooks pertaining to each of the combinations of BUs and product classes. This is where the results get populated and stored automatically
- Executing models as per the steps laid out in section above
It takes around 40 minutes to run the models for 40-plus reporting segments. This enables simplifying the process so that the actuarial resources could just focus on reviewing the numbers and efficiently use their time. As opposed to the existing process, which involved multiple people using different Excel models and disparate data sources, the proposed model reduced the average time by approximately 50%.
Results
For benchmarking purposes, the model was run for each month from February 2017 to November 2018, because it was possible to calculate the actual unclosed business or unearned premiums for these months. The model outputs were compared with the actual unclosed and the unclosed premium booked by the client in general ledger for these months.
It was observed that the new model does better in terms of accuracy for all BUs. It was observed that the 50th percentile was a good prediction for all BUs for most months. In the peak months, like June and December, the 95th percentile was better at predicting the unclosed premium. In addition, for BUs with a very low volume of business in certain months, the 5th percentile fared well.
Conclusion
The advantage of the method proposed in this article over the traditional chain ladder is that it will automatically take into consideration the seasonality in data as resampling of residuals happens. Unlike traditional approaches like chain ladder, 12-month rolling averages require minimal intervention when selecting development trends. Its design allows for the addition of more BUs/reporting segments in the future. It just requires the data in the set format, allowing greater process efficiency. This approach is a win-win solution with respect to standardization, efficiency and accuracy, as was demonstrated with our client’s experience.
A final caveat is that one does not discount the need for review. The estimates produced by the model must be used in conjunction with new information that the business/underwriters possess, because the model takes historical data as an input.