This is the second in a series. The first article can be found here.
Our industry is facing a major problem related to hazard data: More hazard and event data providers are producing higher-resolution footprints for a larger number of catastrophic events than ever before.
All this data is difficult (and, in some cases, impossible) for insurers to process fast enough to deploy timely responses to their insureds.
If this problem sounds all too familiar, you’re not alone. At SpatialKey, working with our clients has highlighted a consistent struggle that many insurers are facing: There is a gap between the wealth of data available and a carrier’s ability to quickly process, contextualize and derive insight from it. Carriers that try to go it alone by relying on in-house data teams may find that they’re spending more time operationalizing data than deriving value from it, particularly during time-sensitive events.
Catastrophe data has evolved tremendously with our data partners, such as KatRisk, JBA and Impact Forecasting, becoming more agile and producing outlooks, not only during and after events, but well ahead of them. We’re seeing a push among our data partners to be first to market with their forecasts as a means to establish competitive advantage. And, while this data race has the benefit of generating more information (and views of risk) around a given event, it also creates a whole lot of data for you, as a carrier, MGA or broker, to keep up with and consume.
Three key considerations that arise while operationalizing data during time-sensitive events are:
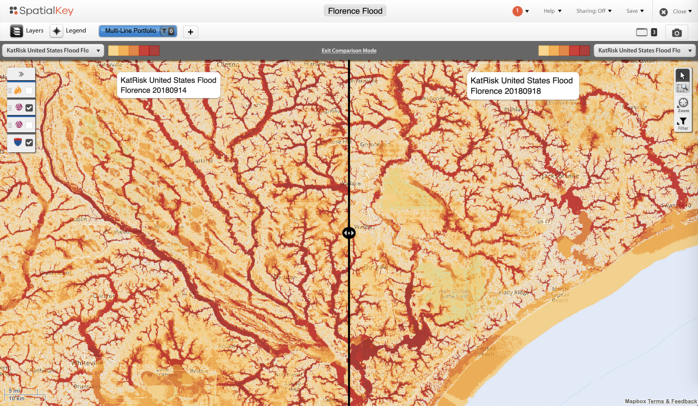 Using SpatialKey’s slider comparison tool, you can see KatRisk’s initial inland flood model for Hurricane Florence on the left, compared with the final footprint on the right. The prolonged flooding led to multiple updates from KatRisk, enabling insurers to gain a solid understanding of potential flood extents throughout the event—and well in advance of other industry data sources.
See also: Using Data to Improve Long-Term Care
Over the course of Hurricane Florence, SpatialKey received five different file updates from just one data provider. That means that, for the data partners that we integrate with during an event like Hurricane Florence, we load upwards of 30 different datasets into SpatialKey! If you’re bringing this type of data processing in-house, it’s both time-consuming and tedious; in the end, you may end up with limited actionable information because you can’t effectively keep up with and make sense of all the data.
A solution that supports a data ecosystem and interoperability creates efficiencies and eases the burden of operationalizing data, especially during back-to-back events like we’ve seen the last two hurricane seasons.
2) Hazard data sophistication
Beyond just keeping up with the sheer volume of data during the course of catastrophes, being able to process high-resolution models and footprints is now a requirement. Many legacy insurance platforms cannot consume the quality and resolution requirements that today’s data providers are churning out.
High-resolution files are massive and a challenge to work with, especially if your systems were not designed for the size and complexity of these files. If you’re attempting to work with them in-house, even for a small-scale, singular event, it requires a lot of machine power. The most sophisticated organizations will struggle to onboard files that are 5-, 10- or 30- meter resolution, such as the KatRisk example above. And, doing so could make the model prohibitive, meaning you’ll have spent time and money on data that you won’t be able to use.
3) Dependency on in-house GIS specialists
The job of 24/7 data puts an enormous strain on data teams, especially during seasons where back-to-back events are common. For example, during hurricanes Michael and Florence, our SpatialKey data team processed and made available more than 50 different datasets over the course of four weeks. This is an intense effort with all hands on deck. Insurers that lack the expertise and resources to consume and work with the sheer volume and complexity of data that is being put out by multiple data providers during an event may find the effort downright grueling—or even impossible.
Additionally, an influx of data can often mean overworking a key player on your data or GIS team, leading to backlogs and delays in making the data consumable for business users who are under pressure to report to stakeholders and understand financial impact—while pinpointing affected accounts.
The role of a data team can be easily outsourced so your insurance professionals can go about analyzing, managing and mitigating risk.
It’s time to automate how you operationalize data
As catastrophes grow in frequency and severity, it’s time to explore how you can easily integrate technology that will automate the process of operationalizing data.
See also: Turning Data Into Action
Imagine how much time and effort could be diverted toward extracting insight from data and reaching out to your insureds rather than processing it during time-critical events. There’s an opportunity cost to the productivity that your team members could be producing elsewhere.
Check back for Part 3 of this series, where we’ll quantify the actual time and inefficiencies involved in a typical manual event response workflow.
Using SpatialKey’s slider comparison tool, you can see KatRisk’s initial inland flood model for Hurricane Florence on the left, compared with the final footprint on the right. The prolonged flooding led to multiple updates from KatRisk, enabling insurers to gain a solid understanding of potential flood extents throughout the event—and well in advance of other industry data sources.
See also: Using Data to Improve Long-Term Care
Over the course of Hurricane Florence, SpatialKey received five different file updates from just one data provider. That means that, for the data partners that we integrate with during an event like Hurricane Florence, we load upwards of 30 different datasets into SpatialKey! If you’re bringing this type of data processing in-house, it’s both time-consuming and tedious; in the end, you may end up with limited actionable information because you can’t effectively keep up with and make sense of all the data.
A solution that supports a data ecosystem and interoperability creates efficiencies and eases the burden of operationalizing data, especially during back-to-back events like we’ve seen the last two hurricane seasons.
2) Hazard data sophistication
Beyond just keeping up with the sheer volume of data during the course of catastrophes, being able to process high-resolution models and footprints is now a requirement. Many legacy insurance platforms cannot consume the quality and resolution requirements that today’s data providers are churning out.
High-resolution files are massive and a challenge to work with, especially if your systems were not designed for the size and complexity of these files. If you’re attempting to work with them in-house, even for a small-scale, singular event, it requires a lot of machine power. The most sophisticated organizations will struggle to onboard files that are 5-, 10- or 30- meter resolution, such as the KatRisk example above. And, doing so could make the model prohibitive, meaning you’ll have spent time and money on data that you won’t be able to use.
3) Dependency on in-house GIS specialists
The job of 24/7 data puts an enormous strain on data teams, especially during seasons where back-to-back events are common. For example, during hurricanes Michael and Florence, our SpatialKey data team processed and made available more than 50 different datasets over the course of four weeks. This is an intense effort with all hands on deck. Insurers that lack the expertise and resources to consume and work with the sheer volume and complexity of data that is being put out by multiple data providers during an event may find the effort downright grueling—or even impossible.
Additionally, an influx of data can often mean overworking a key player on your data or GIS team, leading to backlogs and delays in making the data consumable for business users who are under pressure to report to stakeholders and understand financial impact—while pinpointing affected accounts.
The role of a data team can be easily outsourced so your insurance professionals can go about analyzing, managing and mitigating risk.
It’s time to automate how you operationalize data
As catastrophes grow in frequency and severity, it’s time to explore how you can easily integrate technology that will automate the process of operationalizing data.
See also: Turning Data Into Action
Imagine how much time and effort could be diverted toward extracting insight from data and reaching out to your insureds rather than processing it during time-critical events. There’s an opportunity cost to the productivity that your team members could be producing elsewhere.
Check back for Part 3 of this series, where we’ll quantify the actual time and inefficiencies involved in a typical manual event response workflow.
- Continuous file updates make it difficult to keep up with and make sense of data
- Processing sophisticated data requires a new level of machine power, and, without it, you may struggle to extract insights from your data
- Overworking key players on your data or GIS team leads to backlogs, delays and inefficiencies
Using SpatialKey’s slider comparison tool, you can see KatRisk’s initial inland flood model for Hurricane Florence on the left, compared with the final footprint on the right. The prolonged flooding led to multiple updates from KatRisk, enabling insurers to gain a solid understanding of potential flood extents throughout the event—and well in advance of other industry data sources.
See also: Using Data to Improve Long-Term Care
Over the course of Hurricane Florence, SpatialKey received five different file updates from just one data provider. That means that, for the data partners that we integrate with during an event like Hurricane Florence, we load upwards of 30 different datasets into SpatialKey! If you’re bringing this type of data processing in-house, it’s both time-consuming and tedious; in the end, you may end up with limited actionable information because you can’t effectively keep up with and make sense of all the data.
A solution that supports a data ecosystem and interoperability creates efficiencies and eases the burden of operationalizing data, especially during back-to-back events like we’ve seen the last two hurricane seasons.
2) Hazard data sophistication
Beyond just keeping up with the sheer volume of data during the course of catastrophes, being able to process high-resolution models and footprints is now a requirement. Many legacy insurance platforms cannot consume the quality and resolution requirements that today’s data providers are churning out.
High-resolution files are massive and a challenge to work with, especially if your systems were not designed for the size and complexity of these files. If you’re attempting to work with them in-house, even for a small-scale, singular event, it requires a lot of machine power. The most sophisticated organizations will struggle to onboard files that are 5-, 10- or 30- meter resolution, such as the KatRisk example above. And, doing so could make the model prohibitive, meaning you’ll have spent time and money on data that you won’t be able to use.
3) Dependency on in-house GIS specialists
The job of 24/7 data puts an enormous strain on data teams, especially during seasons where back-to-back events are common. For example, during hurricanes Michael and Florence, our SpatialKey data team processed and made available more than 50 different datasets over the course of four weeks. This is an intense effort with all hands on deck. Insurers that lack the expertise and resources to consume and work with the sheer volume and complexity of data that is being put out by multiple data providers during an event may find the effort downright grueling—or even impossible.
Additionally, an influx of data can often mean overworking a key player on your data or GIS team, leading to backlogs and delays in making the data consumable for business users who are under pressure to report to stakeholders and understand financial impact—while pinpointing affected accounts.
The role of a data team can be easily outsourced so your insurance professionals can go about analyzing, managing and mitigating risk.
It’s time to automate how you operationalize data
As catastrophes grow in frequency and severity, it’s time to explore how you can easily integrate technology that will automate the process of operationalizing data.
See also: Turning Data Into Action
Imagine how much time and effort could be diverted toward extracting insight from data and reaching out to your insureds rather than processing it during time-critical events. There’s an opportunity cost to the productivity that your team members could be producing elsewhere.
Check back for Part 3 of this series, where we’ll quantify the actual time and inefficiencies involved in a typical manual event response workflow.