
The biggest myth in healthcare is that better care costs more. The city of Fort Worth, Texas busted that myth. Using advanced analytics to establish and monitor a provider network, the city got its injured employees better care while driving its workers’ compensation costs down, not up.
In 2015, Fort Worth had 6,250 employees, and its total workers’ compensation costs ‒ claims plus indemnity payments ‒ were $9.7 million. After implementing the provider network, the city’s costs in 2016 fell to $9.1 million, and they’ve fallen every year since. In 2019, the costs were only $8.2 million, despite the city’s number of employees increasing to 6,900.
How?
How did Fort Worth do it? The city created a physician panel under Chapter 504 of the Texas Labor Code that would be available to its employees only. To identify the providers to include, the city applied the outcome algorithms described below to two juxtaposed data sets and found the providers achieving the best outcomes for each injury type ‒ who cost the city less, not more.
Healthcare is not a commodity. We all think that our doctor is the best ‒ or at least above average ‒ but we don’t live in Lake Wobegon, where all the children are above average. Exactly half of all children are above average, and exactly half are below. It’s the same with doctors ‒ and the specialists and surgeons that they refer us to, and the hospitals that they put us in.
Although counter-intuitive, going to a good doctor costs less overall than going to a bad one. 30% of healthcare costs are unnecessary, the result of poor or ineffective care. Good doctors don’t incur those excess costs because they:
- Make fewer errors;
- Perform fewer unnecessary procedures;
- Experience fewer patient complications; and
- Get their patients better faster.
So how can you do what Fort Worth did? First, you need access to the two data sets on which to run the analytics ‒ your medical and pharmacy claims and your employee absence records. If you’ve self-insured your workers’ compensation program, like Fort Worth does, then you own the medical and pharmacy claims. You still engage a third party administrator (TPA) to process those claims for you, but you are at actuarial risk for them, and therefore you own the claims. If, on the other hand, you’re fully insured ‒ you pay the insurance company a premium, and the insurance company bears the risk ‒ then you won’t own the claims and won’t be able to perform these analytics, although your insurance company could.
If you have the claims, then you match them against the absence records to identify the time that the employee missed from work because of the injury. You can do so in two ways. First, juxtapose the claim dates against your Human Resources (HR) Department’s time and attendance records to find the days missed because of the injury and value that time off at the employee’s pay rate or a normalized rate. Alternatively, you can use the indemnity payments to the employee as a proxy for the absence costs. When a TPA or insurance company uses these analytics, this is the route that they take because they don’t have access to the employer’s HR records.
Next, you must be able to direct care ‒ tell the employee which provider to go to. Every state has its own rules. In Texas, an employer can do so. This can include establishing referral protocols and criteria for medical procedures that don’t require pre-authorization ‒ decreasing the wait times to obtain care and thereby driving down lost days and indemnity payments.
If you meet these three criteria ‒ you own the claims, can direct care and have absence data ‒ read on and learn how you, too, can drive down your workers’ compensation costs while improving the care for your injured employees.

Quantifying Outcomes
We begin with the premise that a “good outcome” is getting an employee back to work and keeping them there. We therefore accumulate all the costs to do so and then rank the providers based on the outcomes that they achieve.
See also: 7 ‘Laws of Zero’ Will Shape Future
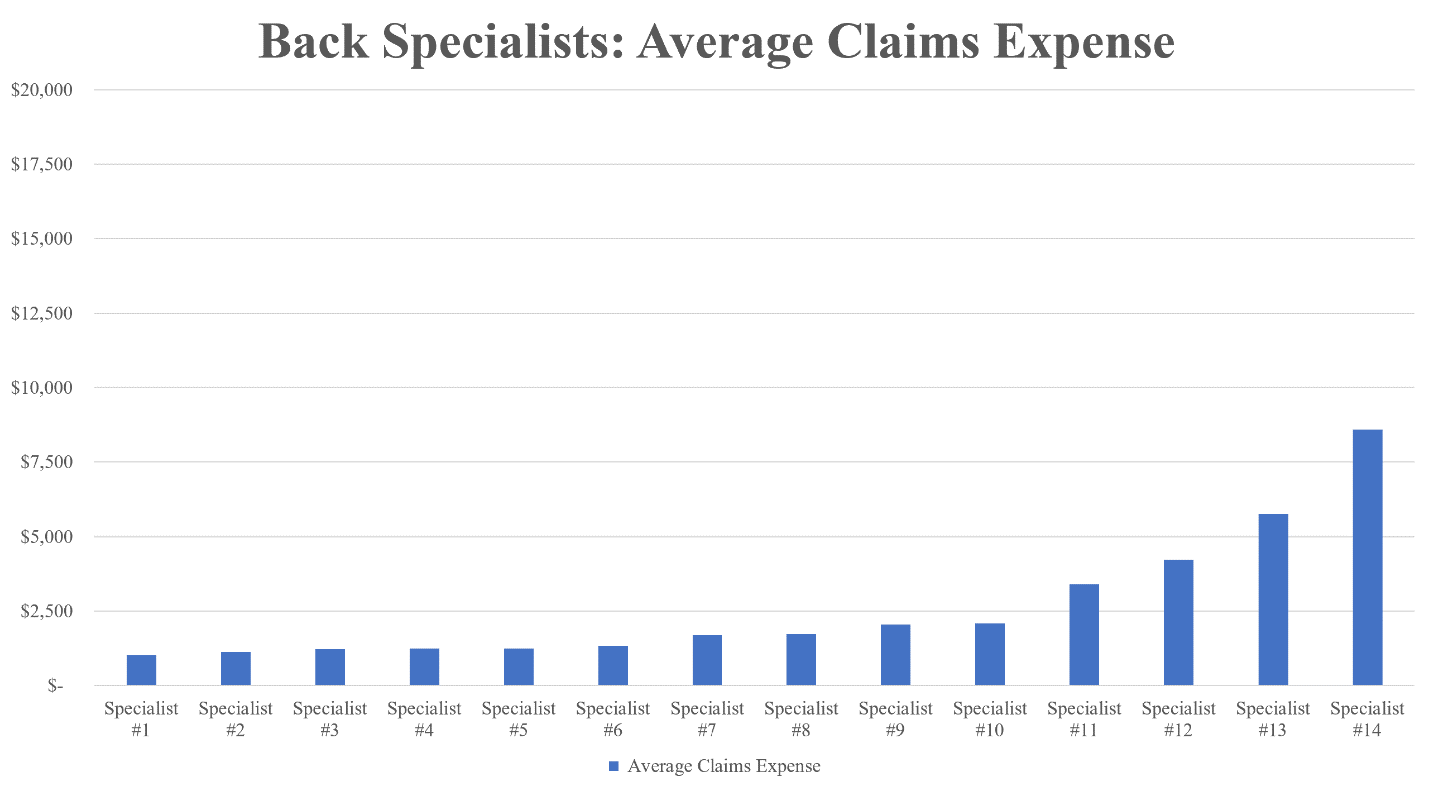
First, let’s look at the claims. The chart below shows the average claims costs for 14 specialists treating back injuries. Specialist #1 on the far left is the best, with average claims costs of $1,000, while Specialist #14 on the far right is the worst, at $8,600.
The claims, however, are only half of it ‒ sometimes less than half. You have to add the absence costs, the amounts that the employer paid the employee while out with their injury. Not only are these absence costs a real cost to the employer, but they double as an indication of the effectiveness of the care. The quicker the doctor got the employee better and back to work, the more effective the doctor was. This chart adds each specialist’s average absence costs on top of their claims.

Now Specialist #2 goes from being second best to second worst; and Specialist #9 is doing a better job than we originally thought because that doctor is getting their patients better and back to work faster.
There’s one more step. If you ask any doctor why their costs are more than another doctor’s, they’ll always give the same answer: “Because my patients are sicker.” And sometimes they’re right.
Sicker patients cost more and take longer to get better. If you have two employees with the same back injury, one of them young and otherwise healthy, while the other is older, overweight and diabetic, the older employee is going to cost more. So we adjust for comorbidities by assigning each employee a risk score. That way our rankings are based solely on the provider performances, not the patients that they treated.
There are a number of risk-scoring systems. One that is open-source is the Chronic Illness and Disability Payment System (CDPS). CDPS was designed by the University of California, San Diego and is employed by many Medicaid programs around the country. Accordingly, it is demographically appropriate for a working age population.
The CDPS system looks at various demographic and clinical data, including age, gender, diagnoses and the prescription drugs that a patient is taking and assigns the patient a score: 1.00 being an individual of average health, below 1.00 healthier than normal (the lower the score, the healthier) and above 1.00 sicker (the higher the score, the sicker).
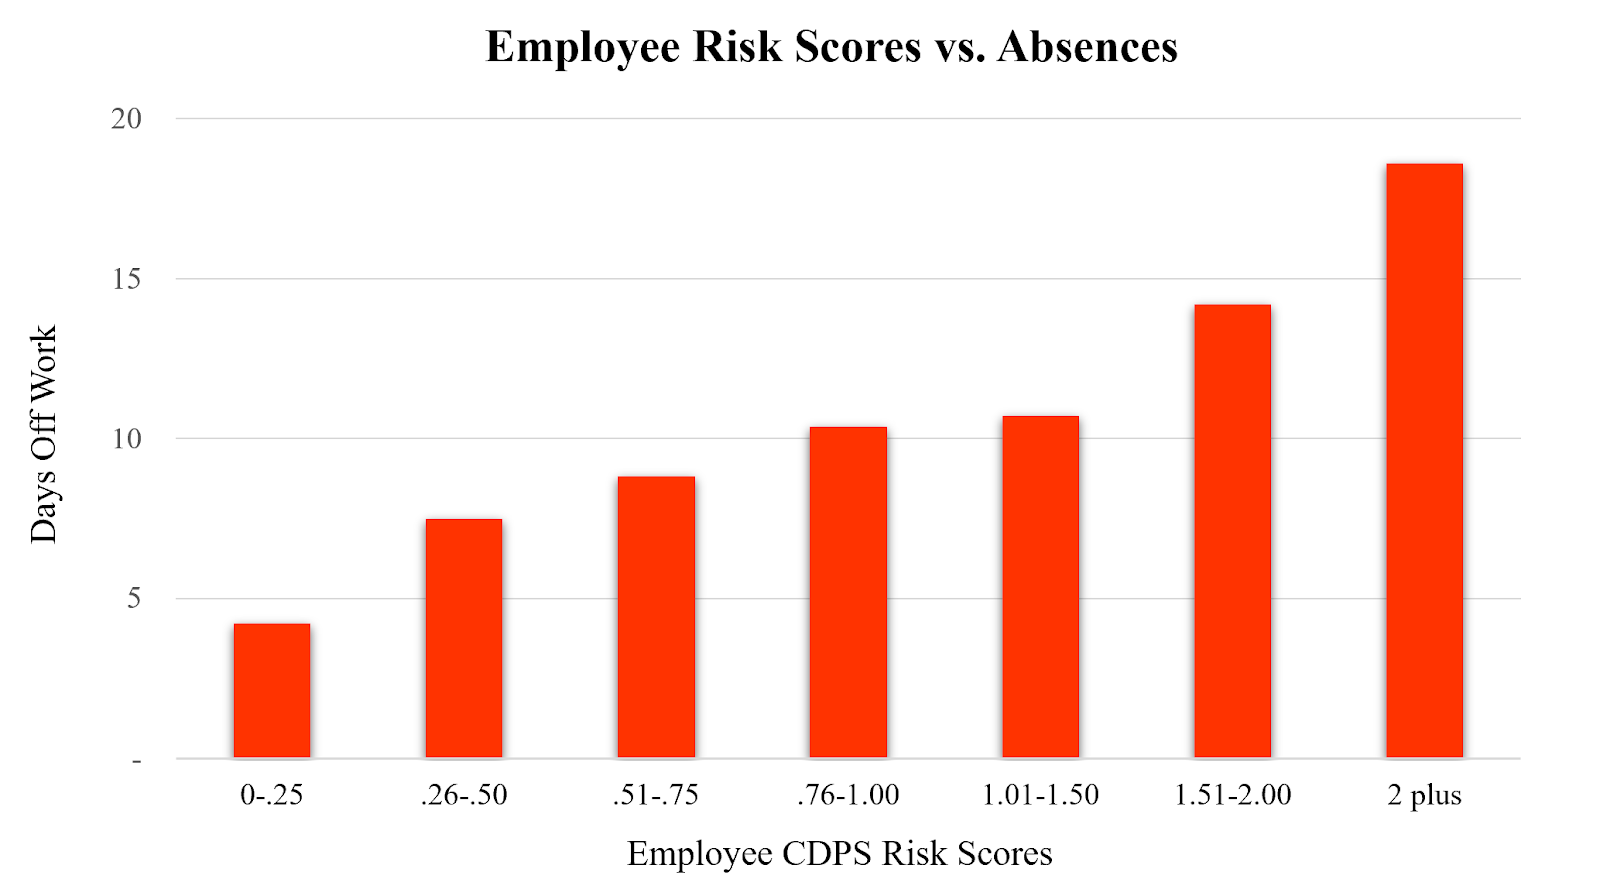
The chart below shows the relationship between an employee’s risk score and the number of days that they miss from work. As you would expect, the higher the risk score ‒ the less healthy the employee ‒ the more time that they miss.
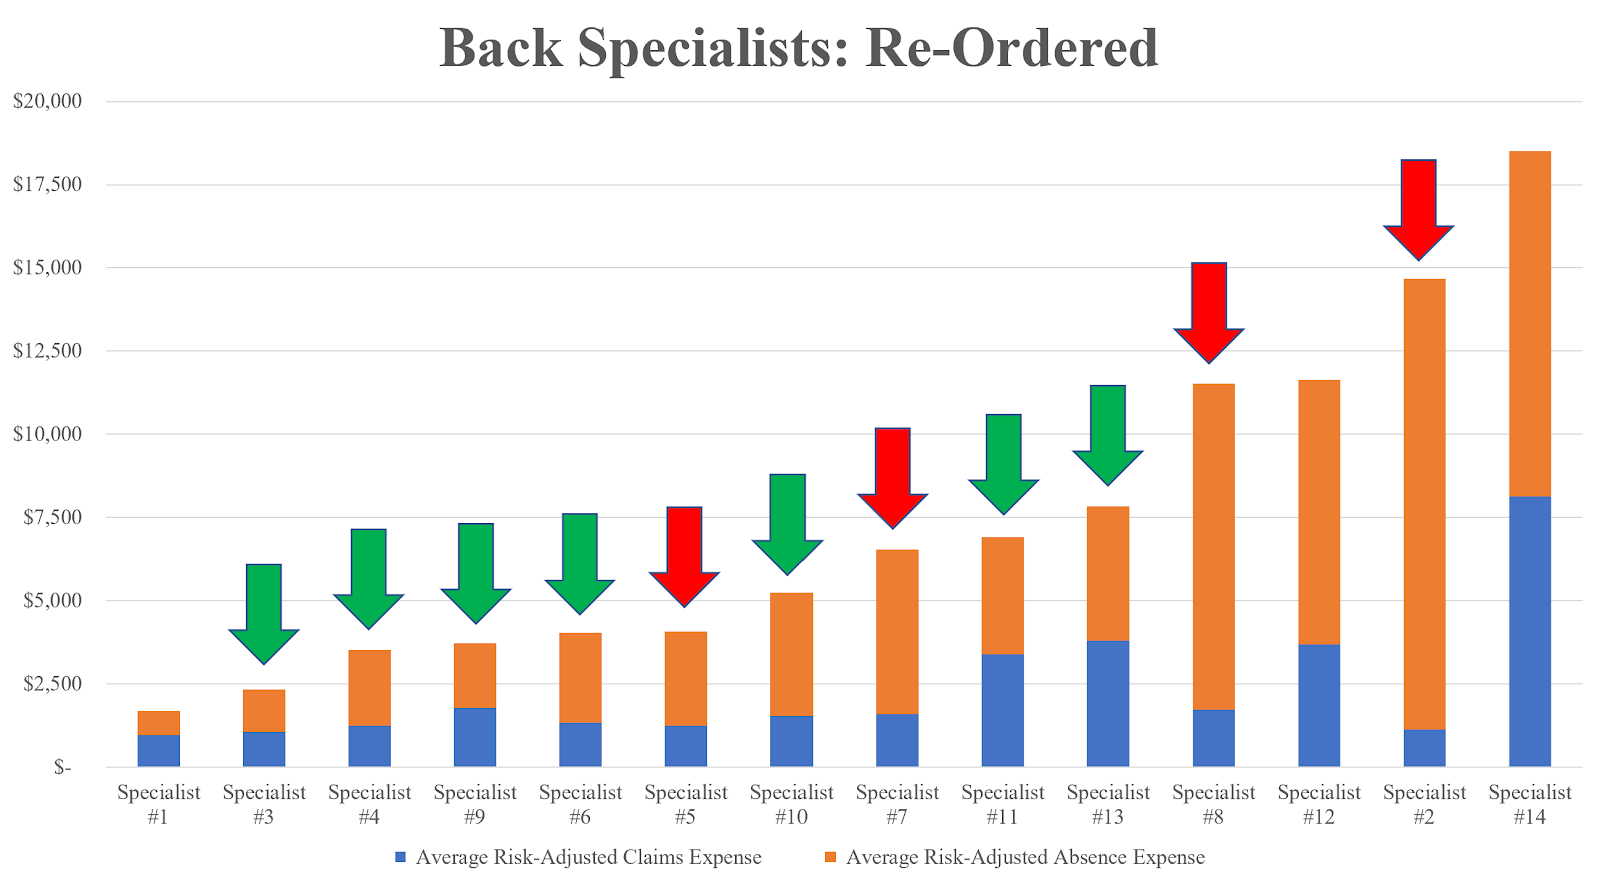
Going back to our back specialists, when we risk-adjust their patients and level the playing field the results change again.

Now the doctors’ total costs and rankings are based on their performances, not the patients that they treated. Doing this, we see that Specialist #13 was doing a better job than we initially thought. This doctor would now be ranked 10th, not 13th.
When we re-order the doctors based on their average risk-adjusted total costs, Specialist #1 is still the best, and Specialist #14 is still the worst. But other than Specialist #12, the order has completely changed. The green arrows show the doctors who moved up, and the red arrows show the ones who moved down.
We can also show this on a quadrant graph. Along the horizontal axis, we graph each provider based on their average claims costs relative to the group average, and along the vertical axis we do the same for the absence costs. The best providers are in the upper right quadrant ‒ low claims costs and low time off ‒ and the worst providers are in the lower left quadrant, with high claims costs and high time off.

Fort Worth’s Provider Network
Fort Worth used these analytics to identify the best providers by injury type and then placed them in its own workers’ compensation provider network. An injured employee must stay within this panel when seeking treatment.
But Fort Worth didn’t just look at its workers’ compensation claims and rank the doctors handing its current cases. Instead, it threw in its health plan claims, too. That way, it identified great doctors not currently handling workers’ compensation cases, but whom the city wanted to in the future.
By sending injured employees to the best doctors, Fort Worth achieved fantastic results ‒ a decrease of 23% in its costs while getting its employees better care!
Benchmarking and Predictive Analytics
Fort Worth didn’t stop there, but incorporated the Official Disability Guidelines (ODG) for benchmarking and predictive analytics, too. ODG is a nationwide database of workers’ compensation and occupational health injuries owned by the Hearst Health Network.
Using these guidelines, Fort Worth not only compares the providers in its network against one another but benchmarks them against national and regional best practices and averages for claims, time off work and other metrics. These other metrics include whether the doctor is seeing the employee more often than usual for a particular type of injury, or whether the doctor is billing unusual procedure codes (which could be either good or bad but bears investigating). In addition, comparing claims against the database allows Fort Worth to categorize them as being within the normal range for that injury type ‒ which the city can pay without further scrutiny ‒ or outside those norms, in which case the city flags the claims for investigation.
Fort Worth also uses the guidelines to perform predictive analytics. When an injury occurs, the city predicts the claims and lost time based on specific factors and then monitors the case and intervenes early when the actual results begin to stray from the predicted ones. For example, using ODG, the table on the left predicts 47 days off and $7,925 in total expenses for an employee suffering a lower back sprain with the following particulars:
- 40 years old
- Living in Texas
- Job involves “medium” physical demands (not sedentary, like an office worker, or heavy, like a construction worker)
- No risk factors or comorbidities
- Case involves some time off work, so it is more severe (80% of all workers’ compensation cases involve only medical expenses, no lost time)
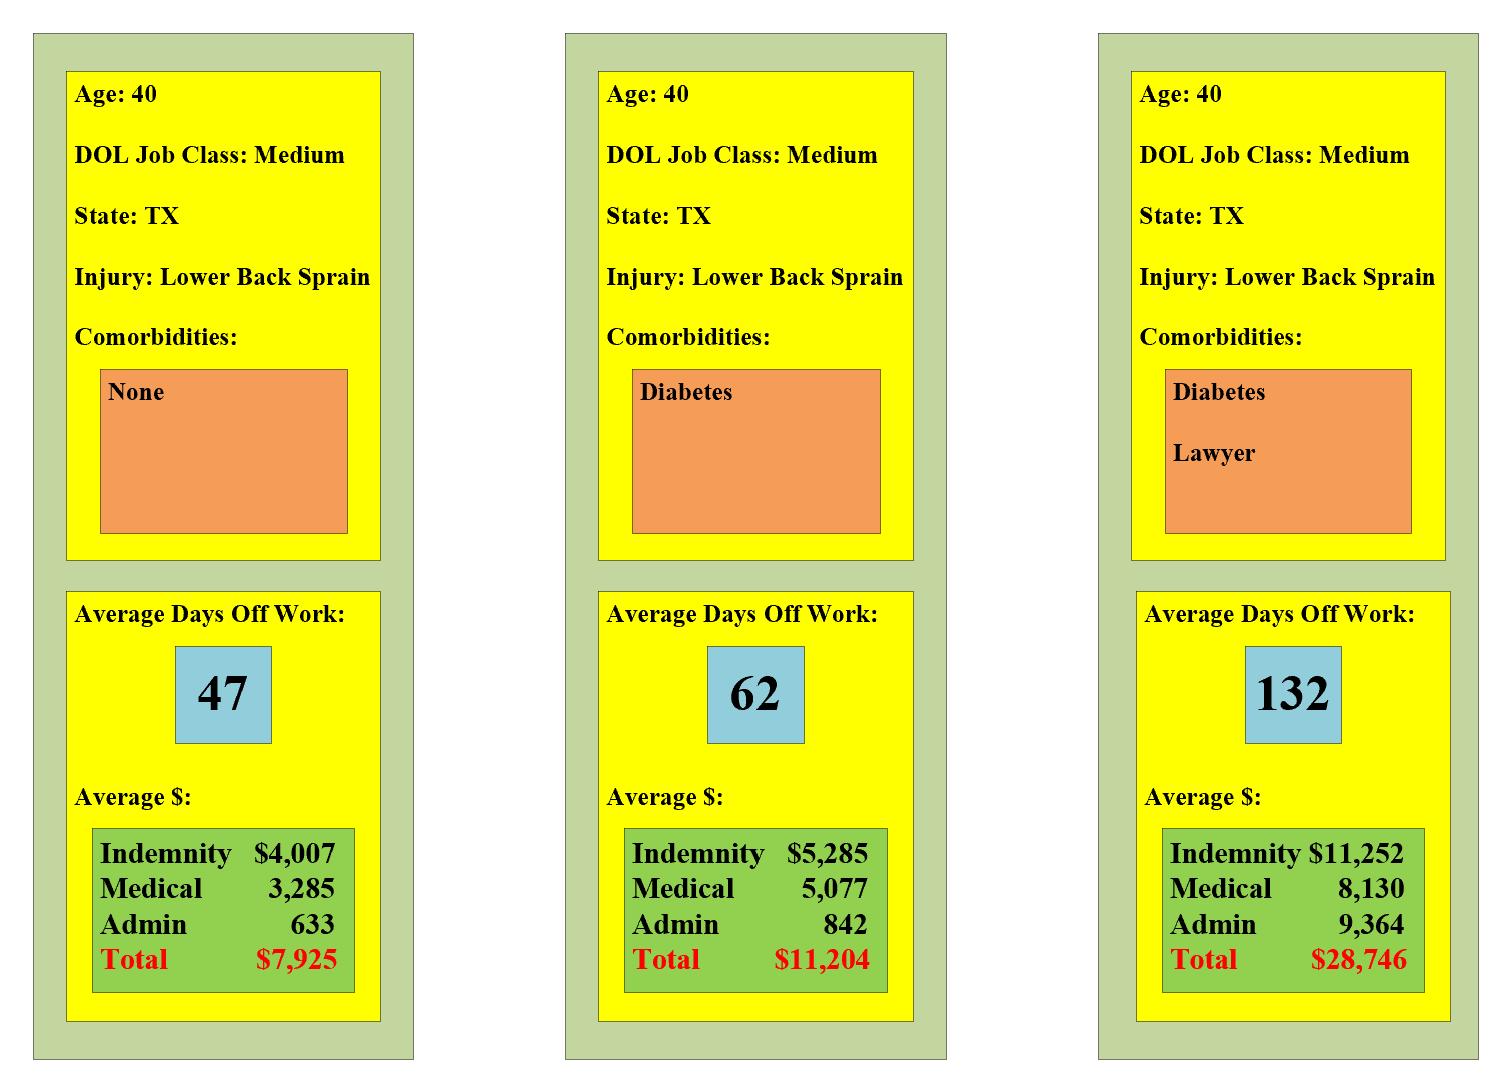
The table in the middle shows that keeping everything the same, except adding that the employee has diabetes, increases the prediction to 62 days off and $11,204 in total expenses. And the table on the right shows that, if the employee hires a lawyer ‒ not a comorbidity for an employee, but definitely a risk factor for an employer ‒ everything more than doubles!
Health Plans
You can use these analytics for your health plan, too. When doing so, there are two differences.
As discussed above, in workers’ compensation, many states permit the employer to direct care. In most health plan settings, however, you can’t do that. You can only encourage someone to go to the best doctor. They can go to whomever they want.
So how do you get your employees and their dependents ‒ your health plan members ‒ to the best doctors for what they need? You could ask your TPA to include only the best doctors in the provider network, or at least eliminate the worst ones, but your TPA usually won’t do that. In fact, many of the contracts that TPAs sign with health systems preclude the TPAs from excluding any of the health system’s providers from the network or steering patients away from them.
Although you won’t be able to set the network, you can stratify it. Tier the network and decrease or eliminate co-pays and out-of-pocket costs when members go to the best doctors. If you have an HDHP (High Deductible Health Plan) married with HSAs (Health Savings Accounts), you can even pay employees to go to the top-ranked doctors by contributing to their HSAs when they do so.
You can also give a list of the best providers for each root diagnosis to:
- The case managers handling your high-cost and chronically ill members so that those case managers can suggest the best providers to them;
- The primary care physicians (PCPs) in your network to use when referring your members to specialists and surgeons; and
- The employees themselves so that they and their dependents can look up the best providers for what they need.
The second difference is that your health plan will have not only employees in it but their dependents, too. You won’t be able to use the algorithms above on the dependents because you won’t have any absence data to match against their claims.
See also: Startups Must Look at Compensation Plans
Instead, you can use a different algorithm on the dependents that uses only the claims data. For the employees, we combine the claims and absence data and ask how much it cost and how long it took to get the employee back to work and keep them there. For the dependents, we flip the question and ask how much it cost in claims to keep them well.
We define being well in terms of healthy days, which we can see in the claims. Healthy days are days that the person does not spend in the healthcare system (e.g., hospital stays, doctor’s visits, etc.) or at home in a non-functional state (e.g., recuperating or otherwise unable to carry out their normal activities).
We put this information in a fraction. The numerator is the patient’s risk-adjusted claims for a particular root diagnosis during the year, and the denominator is the patient’s healthy days during that year. We then rank each provider by root diagnosis, from the best with the lowest average risk-adjusted claims per healthy day when treating patients with that condition, to the worst with the highest.
Not only can you rank providers based on their claims per health day, but you can rank wellness programs and just about anything else, too. The chart below compares the risk-adjusted claims per healthy day to keep employees with behavioral health issues at work (instead of out sick) against the claims per healthy day to keep employees without those issues at work (almost everyone has some claims and absences during a year). The risk-adjusted claims per healthy day for a person without any issues is $10, while the claims per day for a person with headaches is double that at $21 per day, and the claims per day for a person with drug and alcohol problems is double that again at $44.

Better Care at Lower Costs
,Fort Worth busted the myth that better care costs more. By sending injured employees to the best doctors the city drove down its costs, while getting its employees better care.
This article originally appeared in the March/April 2021 issue of Public Risk, the member magazine of the Public Risk Management Association (PRIMA).