


International insurance broking operates across multi-actor systems without a structured method for reading the connectivity between them. Complexity becomes concrete when renewals stall, when claims escalate without warning, when regulation forces last-minute adjustments. Pressure concentrates in certain places, travels along some pathways, and dissipates in others.
The geometry of these movements is what I call adjacency: the measure of how tightly actors are bound to one another, and how their ties carry or absorb pressure. The concept draws on network theory's insight that structure shapes behavior, and on systems thinking's recognition that interdependence produces non-linear effects. What adjacency mapping adds is an operational instrument calibrated to the specific architecture of international insurance programs, one that translates structural insight into practitioner decisions.
An international program is not a set of bilateral relationships. It is a system in which master clients, local clients, brokers, and insurers connect continuously, and in which a shift in one part alters conditions across the rest. A disputed claim at the local level can reverberate upward until it unsettles the master layer. A regulatory delay in one jurisdiction will delay the entire renewal cycle. When negotiations falter between a master broker and a local insurer, expectations unsettle across several markets simultaneously. The system propagates pressure because its ties differ in weight, consequence, and resilience.
The structure begins with the system's elements. Six actors form the state vector of any program:

Here, Smc denotes the master client, Slc the local clients, Smb the master broker, Slb the local brokers, Smi the master insurer, and Sli the local insurers. The notation names the nodes that matter. The model captures structural connectivity. It measures the presence, intensity, and resilience of operational ties, not the informal influence, cultural distance, or reputational history that also shape relationships. Understanding how the system functions requires capturing how strongly these actors are tied to one another.
The adjacency matrix A fulfils this function. It represents the interaction weights between stakeholders: each element wij indicates the presence and intensity of the relationship between stakeholder i and stakeholder j. The matrix is first constructed in abstract form, mapping the position of each interaction within the system:
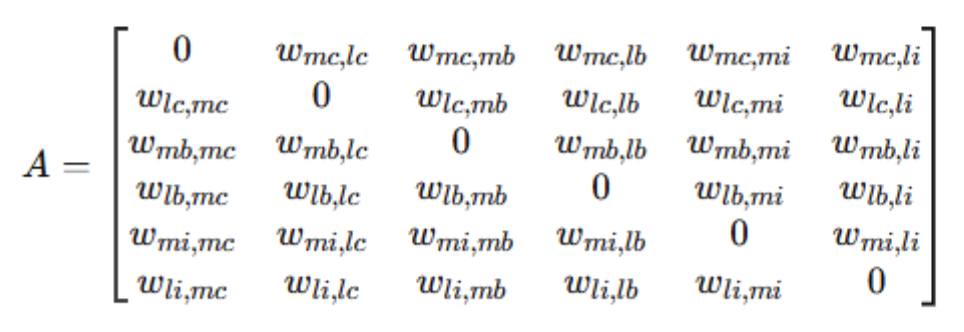
The abstract form locates each relationship within the system. The subscripts identify the two stakeholders involved; the element wij denotes the weight of their tie. The purpose of this construction is to formalize the network so that the system can be analyzed as a structure rather than through accumulated observation. Once defined, weights are assigned on a 0 to 1 scale. On this scale, 0 denotes the absence of adjacency; 0.3 indicates a weak tie with limited interactivity; 0.6 represents strong adjacency with effective coordination; and 1 signals optimal alignment. High adjacency is a marker of capability: two stakeholders are tightly coupled, mutually responsive, and able to sustain efficient workflows. Low adjacency signals fragmentation and the structural risk of disconnection. The weights are practitioner judgements. Their value lies in making an assessment explicit that experience tends to leave implicit. A broker who has managed the same program for a decade carries a mental map of its connectivity. The adjacency matrix makes that map visible, comparable, and open to revision.
Construction begins with a structured assessment across all active relationships in the program. The broker assigns an initial weight to each tie by asking three questions: how often do these actors interact operationally, how reliably does information move between them, and how quickly does the tie transmit pressure when the program is under strain. These criteria are observable without measurement instruments. They are the qualities experienced brokers already assess informally. The matrix makes that assessment formal, consistent, and transferable across programs and teams.
A populated matrix takes the following form:
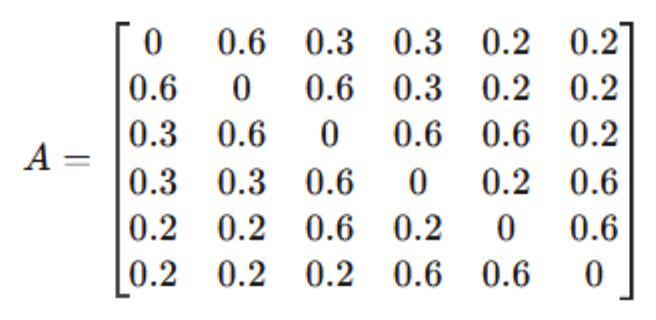
The matrix is a map of the system's connective capacity. A weight of 0.6 between master and local clients reflects strong alignment: headquarters and subsidiaries adjust to one another with speed. A 0.3 between master clients and master brokers indicates a weaker tie, where coordination exists but is less intensive and more susceptible to friction. A 0.2 between master clients and master insurers signals low adjacency: limited interactivity risks disconnection unless brokers actively mediate. A 0.6 between master brokers and local insurers, by contrast, marks a high-value link, one where workflow is active and system coordination is at its strongest. High adjacency marks the ties through which decisions travel, alignment is secured, and operations proceed without friction. Low adjacency marks the fracture lines where interactivity is minimal, silos form, and misalignment compounds.
Adjacency mapping derives its analytical value from the fact that connectivity is never static. Strong ties allow programs to move with speed and coherence. When master and local brokers hold a 0.6 adjacency, coordination is tight and workflow advances without resistance. When a claim escalates across a 0.6 link between local and master insurers, the system responds rapidly. Weak ties do the opposite: they isolate segments of the program, delay decisions, and erode effectiveness.
The architect's objective is to sustain ties at 0.6, the threshold at which alignment holds, coordination costs nothing, and the program moves with structural coherence.
Three patterns govern how pressure moves through the system. Concentration forms where multiple strong ties converge, typically around master brokers holding 0.6+ adjacencies with both local brokers and master insurers. These nodes become coordination hubs, capable of synchronizing decisions across jurisdictional boundaries. Propagation measures the efficiency with which decisions travel. The difference between a 0.6 and a 0.3 tie is the difference between transmission and friction. A 0.6 link between master and local insurers ensures a claim escalates without delay; a 0.3 tie ensures it stalls, and the broker must compensate manually for what the tie fails to carry. Absorption occurs at weak adjacencies of 0.3 or below, where pressure dissipates rather than transmits. Occasionally this buffers noise; more often it marks a structural disconnection that prevents system-wide coordination. These patterns do not operate independently. A weak tie between master broker and local insurer becomes more consequential when the master client to master broker tie is also degraded. Compound weakness across adjacent nodes accelerates fragmentation in ways that no single tie, read in isolation, would predict.
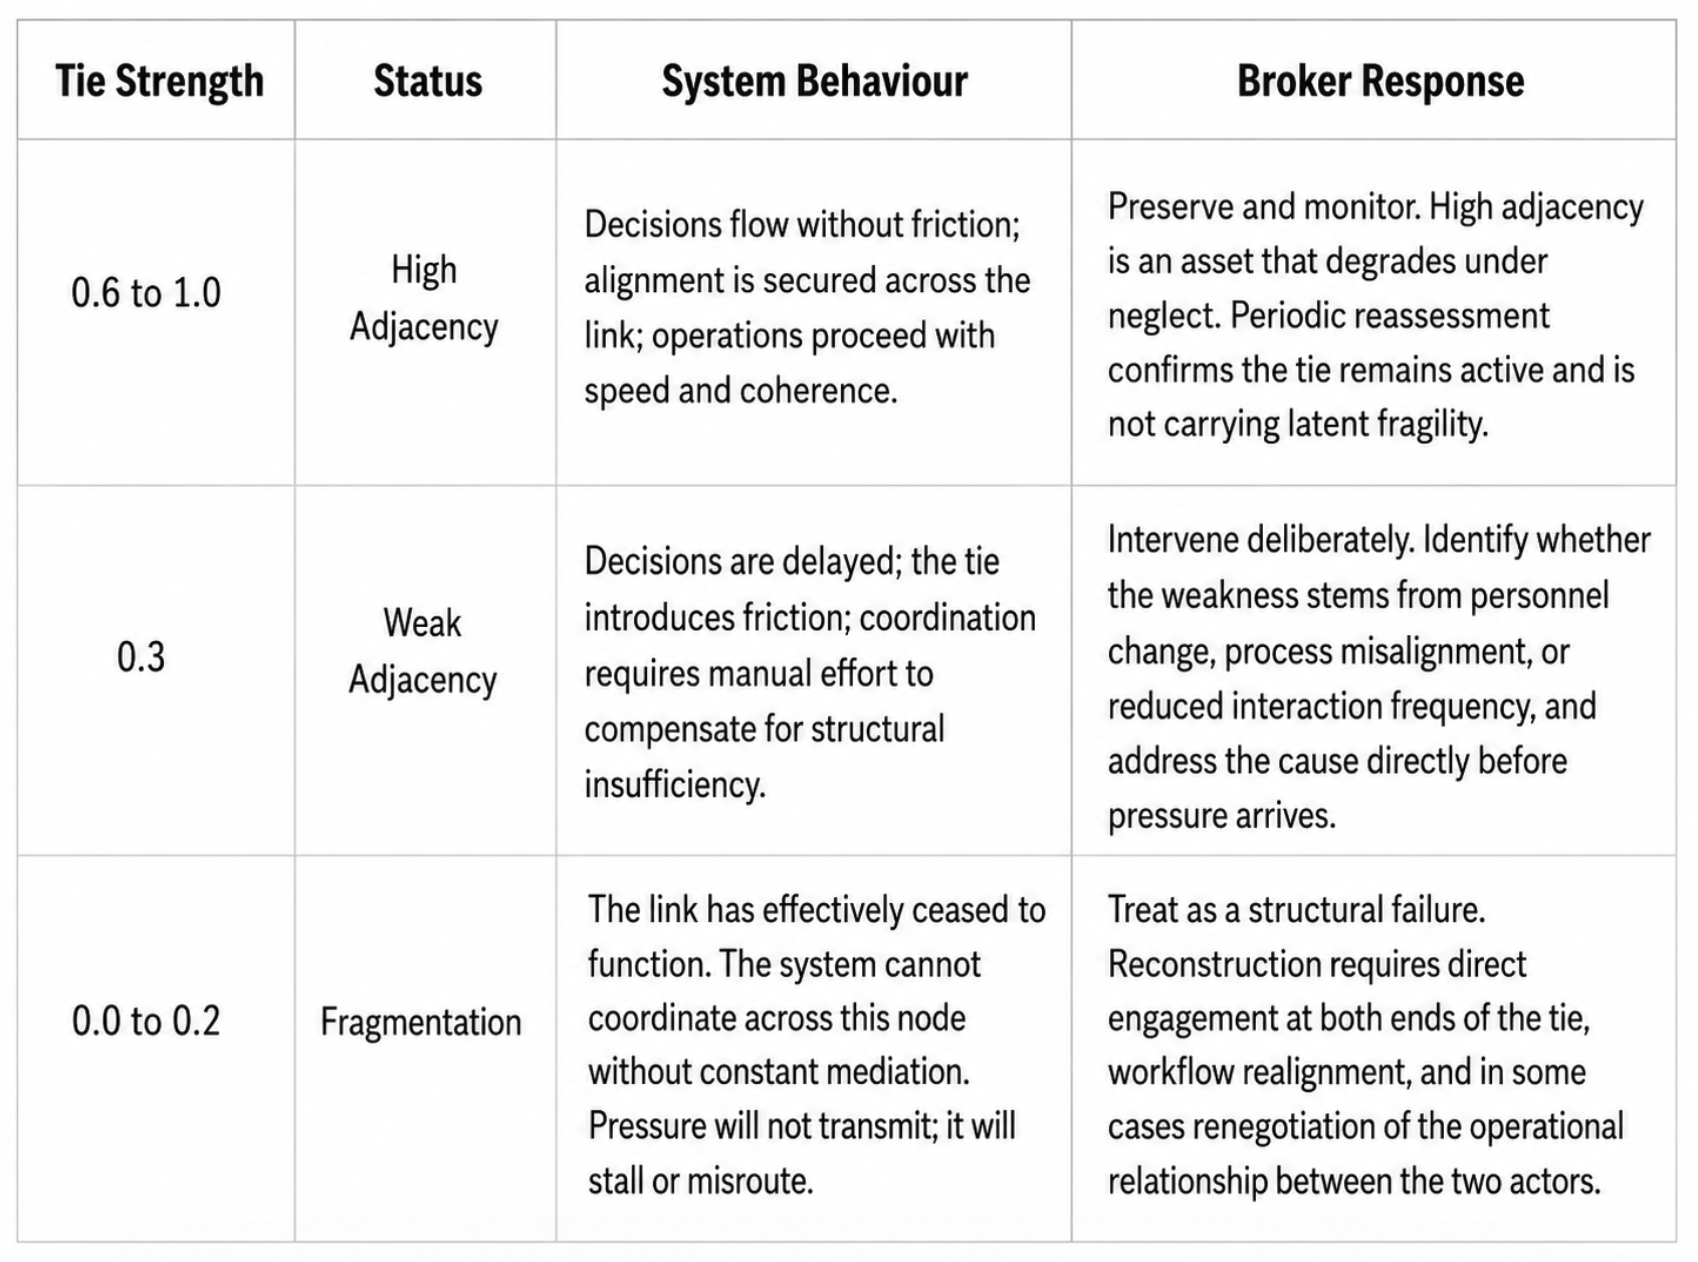
Because ties shift, the map must be kept current. A static diagram decays. A weak link can be reinforced into a strong adjacency by deliberate effort; a strong tie will weaken if neglected. Four events should prompt a reassessment. First, personnel change at any node, meaning the tie shifts with the person. Second, a regulatory change in any jurisdiction covered by the program. Third, a claims event that escalated beyond its expected path. Fourth, the approach of renewal, which is always a structural stress test. Each signals that the weight of at least one tie may have moved without the broker noticing. Adjacency maps are instruments that require periodic review and active maintenance. Brokers who update them see the system. Those who rely on experience alone see only what the system once was.
During renewals, adjacency maps identify which ties sustain workflow and which must be reinforced before they become bottlenecks. In claims, they reveal which relationships enable rapid escalation and which will stall it. Consider a master broker to local insurer tie that registers 0.6 in stable conditions but drops to 0.3 during renewal following personnel turnover at the local level. The map makes this degradation visible in advance. The broker can then rebuild the tie through intensified communication, workflow realignment, or deliberate relationship investment before claims season converts a weak link into a coordination failure. The same logic applies during a major claims event. A local insurer holding a 0.6 adjacency with the master insurer will escalate rapidly and with precision. One holding a 0.3 will delay, misframe, or absorb the claim at the local level, forcing the master broker to intervene manually at precisely the moment when speed matters most. The map identifies this vulnerability before the claim arrives. In regulatory matters, the map shows where connectivity must be strengthened to secure compliance. In each case, the broker acts before disruption, reinforcing the ties the system depends on rather than repairing them under pressure.
The broker who monitors adjacency, reassesses ties under pressure, and rebuilds degraded links before they become failures is sustaining program coherence. That is what rigorous servicing looks like in practice.
The central proposition of adjacency mapping is that program performance correlates with the aggregate strength of ties between its actors. The broker whose counterpart is responsive, informed, and quick to act is not simply lucky in his relationships. He is operating across a tie with high adjacency. When that tie degrades, the program follows, regardless of how well the individuals involved know each other. This is a testable claim. Brokers who map their programs over time will find that degradation in tie strength precedes operational failure, and that deliberate investment in adjacency produces measurable improvements in renewal speed, claims resolution, and regulatory compliance. Together they provide foresight into where the system is strong, where it is fragile, and where investment in interactivity will deliver the greatest return. The program, read this way, becomes a structure with legible geometry.
International insurance broking will always be exposed to uncertainty. Renewals will clash with shifting regulation, claims will appear at awkward times, and timelines will compress under pressure. But complexity is not chaos. By treating programs as systems and adjacency maps as diagnostic instruments, brokers can anticipate rather than endure, and reinforce rather than repair. Pressure still moves through the system. Adjacency maps tell you in advance where it will concentrate, where it will stall, and where it will dissipate unnoticed. In a system this complex, that is the only form of control that holds.