
Large deductible and self-insured workers' compensation programs often face year-over-year increases in their unpaid claim liabilities, even though they are not suffering from adverse claim development, unexpected large losses, or materially changing their risk profile. Why does this keep happening? The increase is the natural result of several external factors, with the biggest drivers being rising indemnity costs and rising medical costs. Why should program managers expect these increases? And how can the inevitability of these rising costs be conveyed to executive management?
The solution starts with recognizing the nature of liability growth and focusing not solely on liabilities but rather on ultimate losses.
How Actuaries Determine Unpaid Claim Liabilities
Actuaries estimate a program's ultimate losses — the amount that will eventually be paid to close all claims that have occurred under the program. For a review as of December 31, 2012, the ultimate losses include all claim payments, current case reserves, and an incurred but not reported (IBNR) provision for any future case reserve development (including reopened claims) and for claims that have occurred but have not been reported as of December 31.
There is one important (non-numerical!) formula that relates to ultimate losses and the resulting reserves called unpaid claim liabilities. The ultimate losses as described above can be shown as follows:
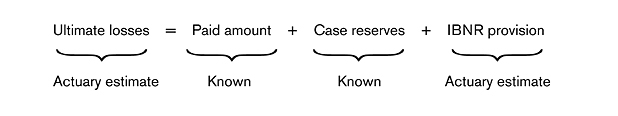
The actuarial report will estimate the total amount to be paid (i.e., ultimate loss) and we know the total amount paid to date from the claim data. The program's remaining obligation is what is left to be paid: the known case reserves and the additional estimated IBNR provision — that is, the remainder of the ultimate loss amount.
Utilizing the estimated ultimate loss and the actual paid losses, we can arrive at the estimated unpaid claim liability:
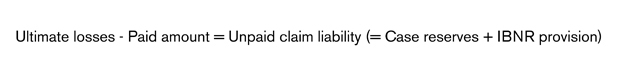
Just as the unpaid claim liability is the ultimate losses minus the paid losses, the change in the unpaid claim liability from one evaluation to the next is the change in ultimate losses minus the change in paid losses. The key to understanding the change in the unpaid claim liabilities is to understand the drivers behind the change in the ultimate losses relative to the change in paid amounts. Because, in an ongoing program, both will theoretically increase at each subsequent evaluation. The amount by which the change in ultimate losses outpaces the change in paid amounts will determine the change in the unpaid claim liability.
When unpaid claim liabilities are increasing, it is really because the ultimate loss estimates for each new accident year are increasing faster than the losses are paid during the calendar year. So what causes the ultimate loss estimates to increase?
Many risk managers are concerned that executive management will perceive increasing ultimate losses and increasing unpaid claim liabilities as a reflection of an underperforming current risk management program as well as claim management practices. However, there are many factors completely unrelated to risk management that influence the unpaid claim liabilities.
Changing risk management practices such as claim reserving methods and claim payment speed, or shifting the type of work performed or injuries incurred, will influence actuarial studies, but we're going to focus on external trends that influence programs and cannot be controlled by risk management. These factors, even with keeping all aspects of the program's risk management consistent from year to year, cause the natural tendency of ultimate losses to grow each year.
An Illustrative Example — Without Trend
While actuaries and risk managers are fluent in the actuarial terms of ultimate losses and unpaid losses as described so far, when describing the cash flows to executive management at a high level it may be easier to think in terms of buying a house and making annual payments on it. If a $250,000 house is purchased, it's clear that ultimately the full $250,000 will be paid. Until then, the remaining unpaid portion is equivalent to the actuarial unpaid claim liability.
Let's say a $250,000 house is purchased and $50,000 payments are made every year for five years to pay it off. An additional house is purchased every year. The first house is purchased in 2012 and, at the end of the year, $50,000 is paid. The unpaid amount is $200,000 ($250,000 - $50,000). In 2013, another house is purchased and a $50,000 payment will be made on each house this year.
At the end of 2013, we know that ultimately $500,000 for both houses is owed and that $50,000 was paid in 2012 for house #1 and $100,000 in 2013 for both houses. The unpaid liability as of December 31, 2013, the remainder left to be paid, is $350,000 ($500,000 - $150,000) — which is an increase of 75% over the prior year end.
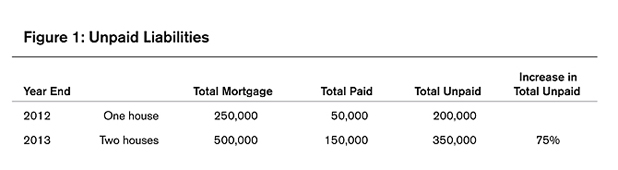
If the same thing is done in 2013 as 2012 (buying a $250,000 house and making $50,000 payments on each), why does the liability go up? It's because the change in ultimate losses (another $250,000) is much larger than the additional $100,000 payments in 2013. In 2013, the ultimate increased by $250,000 for the new year's exposure of an additional house and the payments increased by $100,000 for the two $50,000 payments made on the two houses. The prior liability of $200,000 plus the change in ultimate losses of $250,000 minus the change in payments of $100,000 equals a new liability of $350,000 at the end of 2013.
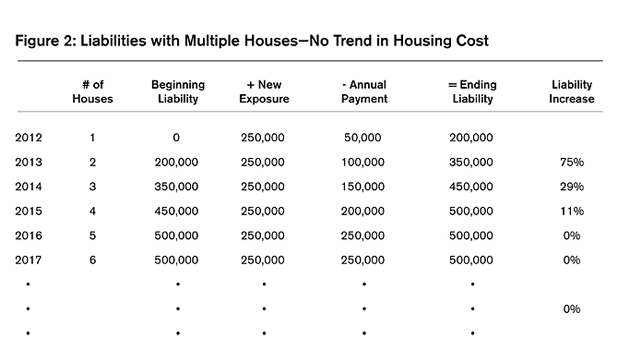
For the next four years, the liabilities will keep increasing. The liability will go unchanged only when the payments made in the calendar year are equal to the new exposure brought on with the purchase of a new house. When five (or more) $250,000 houses are owned, $250,000 in payments will be made each year, offsetting the additional $250,000 in liability picked up with each new house purchased, as shown in Figure 2 below.
Many executive managers (and some risk managers) feel that their programs are in this "steady state" and do not expect to see increases in the liability. However, in the real world of large deductible and self-insured workers' compensation programs, the ultimate losses for each new exposure year are heavily influenced (and increased) by rising medical and indemnity costs. The injuries that cost $250,000 in 2012 dollars will cost more in the future.
An Annual Occurrence?
It is very important that executive management is aware that unpaid workers' compensation claim liabilities are expected to increase each year. And that the increases will be more than inflation (as represented by the consumer price index, or CPI). While other balance sheet items may be subject to inflation only, unpaid claim liabilities are subject to inflation, severity trends, and frequency trends. The 2012 State of the Line annual presentation by the National Council on Compensation Insurance (NCCI) shows a five-year indemnity trend of 2.9% from 2006 to its projection for 2011, with a medical trend of 4.4%, noting that the negative frequency trends that had been offsetting the rising indemnity and medical severity trends are beginning to flatten out.
This means that as business continues into the future, and even if all other variables remain the same, each new year of additional workers' compensation exposure is expected to cost more than the prior year by the aggregate trend. This is analogous to buying the same house every year in a housing market that's rising.
In this next example, the houses bought are 3% more expensive every year. All the houses have similar characteristics from year to year — square footage, tax rates, school districts, etc. — just as from year to year, many companies' workers' compensation exposure stays similar, as far as the number of employees, the mix of NCCI class codes, the location of employees, and the retention limit of the insurance program.
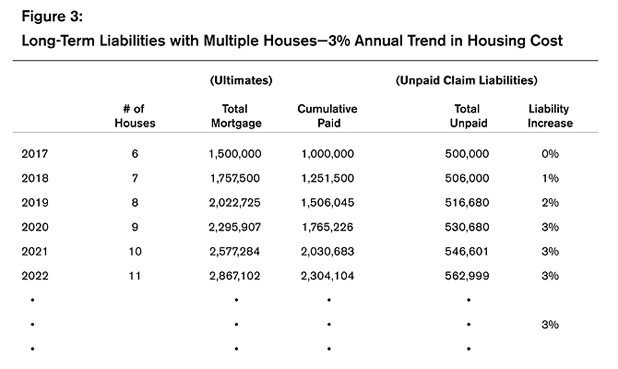
Adding Trend
Continuing from Figures 1 and 2, if a 3% housing increase trend is used, the change in liability will now increase each year and will continue to increase by the 3% trend. In our first example, a constant liability was achieved because the total calendar year payments ($50,000 on each of the five houses with a mortgage at any one time) lowered the liability the same amount as the new house raised the liability each year.
In the 3% trend example below, payments are made on less expensive houses while the incoming houses are the most expensive. In 2018, the first trended house is purchased for $257,500 ($250,000 × 1.03). The first of five payments is made on this house for $51,500. Each of the other four outstanding mortgages is still being paid at $50,000 each, so in 2018 a total of $251,500 is paid. But this is $6,000 short of the $257,500 change made to the ultimates when the new house was purchased.
Recognizing that the majority of payments are being made on mortgages (or claims) in earlier, "cheaper" years, while more expensive, trend-influenced mortgages/claims are being brought onto the program's liabilities, is the key to accepting the natural rise in liabilities over time.
Large deductible and self-insured workers' compensation programs face liability increases that are due to cost trends every year. In order for a program's liabilities to stay at the same level or decrease, the program would have to overcome these trends. But inflation, severity, and frequency trends aren't the only variables out there.
What To Watch For In The Future
As the economy recovers and workforces grow, this will increase the future additional costs applied to the program's liabilities. As a workforce increases by 1%, 3%, or 5%, so too do the anticipated ultimate losses for the next year. It would be comparable to buying a house with 1%, 3%, or 5% more square footage at the same cost per square foot.
Additionally, as the insurance market slowly hardens, programs may begin raising their retention levels. As the retention levels rise, so do the oncoming liabilities. Retention level increases will have a much larger impact than trend increases, as retention levels can increase by substantial amounts. In this example, a workers' compensation retention increase from $250,000 to $500,000 is similar to suddenly buying more expensive houses. While a 3% trend will raise the house price from $250,000 to almost $300,000 over six years (and raise liabilities by 3% each year), a jump to buying $500,000 houses will noticeably increase the liability with the addition of $500,000 mortgages, while most payments on the houses are in the range of $250,000 to $300,000.
In these examples, a very even payment pattern was used, but it is also important to note that the timing of payments influences the unpaid claim liabilities. In real life, workers' compensation payments may not be this regular, and large claims can have sudden payouts due to judgments or settlements.
As shown in the earlier formula, unpaid claim liabilities are equal to the ultimate losses minus the paid amount to date. Let's say that a decision is made to fully pay one of the mortgages on these houses. An additional payment of $250,000 would decrease the liabilities by $250,000. And while this large payment will decrease the liability, it does not have an effect on what is paid in total — the ultimate payments will remain the same — they just have to be paid sooner. And the decrease in the liabilities came from an equal decrease in the assets, which will offset on the financial statements.
Your actuary can explain and quantify the trend effects on your insurance program in detail and how any other changes in your program (to retention levels, employment levels, etc.) will affect the liabilities going forward. Internally, the actuarial report should be reviewed for its information on the change in the program's ultimate losses, which is a better reflection of the program's performance over time than the change in liabilities over time that is due to their sensitivity to payment timing.
Risk managers who need to manage executive management's expectations on unpaid claim liability growth can explain the external factors that play a large role in changing liabilities over time. If liabilities are increasing with the increasing trends, that's to be expected. If liabilities are increasing less than trend, staying flat, or decreasing, that's great. If liabilities are increasing by more than trend, ask your actuary for some suggestions.
A safety analysis can help identify which kinds of injuries make up the majority of the loss dollars, the program's retentions and allocation methodology can be reviewed, or for a thorough review of claims, predictive analysis can zero in on loss drivers.
An actuary can't make external trends disappear but can help explain them to executive management and make other suggestions on finding solutions in your data.