(hint: the key to lower health care and absence costs isn't about health)
When medical and disability costs are high, conventional wisdom assumes there must be more illness driving up costs, right? But how much of total cost can we actually attribute to health status versus other factors?
Four components contribute to health and absence costs. It may surprise some readers to learn that health status is not as powerful a predictor of cost as one might expect. Research from nearly two million employees and their families across the US shows that a shockingly small amount of the variation in health care costs can be attributed to health status alone.
This article describes how each of four components independently influences cost when all the others are held constant. The first two components contributing to medical costs and absence involve "non-modifiable" costs that cannot easily be influenced or changed, while the second two parts involve costs we consider to be "modifiable."
The results come from a sophisticated statistical analysis of health and absence data, along with hundreds of other variables about the companies, workers and jobs (1).
Part I: Basic Needs And Bad Luck
Could health care and disability costs actually go to zero if we had a very young, generally healthy population? Clearly no. To explore the possibility though, we constructed a model that would approximate such a population. We selected characteristics that correlate with lower costs. We took a young (late 20s), mostly male, single (not having children), highly-educated, highly-paid workforce, in a region known for low-cost care, with all benefit policies and business practices aligned for optimal use of benefits.
Can you guess what it would cost to cover the health care spending of this virtually risk-free group? Our data say it is somewhere near $1,300 on average per year. Some costs would be associated with basic needs and some would be the result of misfortune due to genetics or accidents. As you might expect, the majority in this population would have very small expenditures, with a few high outliers. One can debate whether this number is valid because it is virtually impossible to have a population this young, highly-paid, in a specific region, and with a specific gender and marital-status profile. However, it was never intended to be an achievable situation, just the lowest imaginable.
So, the lowest imaginable total for Part I: $1,300 per adult person per year.
Part II: Demographics And Labor Market Face it, age matters and our bodies wear out. Where we live and the type of work we do also matter.
To explain how demographics and labor market affect cost, figure, on average:
- Older workers spend more on health than younger workers;
- Women cost more than men (at least up to a certain age);
- Lower education and lower salary correlate with higher medical and absence costs; and
- Health care in some regions costs more (North East) than others (Rocky Mountain).
Companies naturally hire a workforce with the skills and characteristics needed for the services and products they produce. One company might attract an older, mostly female, less-educated workforce who will earn minimum wage in Missisippi. Another might attract highly-skilled, younger, male engineers in Boston. Because most companies tend to have a consistent labor market to choose from, and because the demographics of those hired rarely involve drastic changes in type of workers, level of pay, or location, we consider the "Demographics and Labor Market" part of cost to be largely non-modifiable.1
To illustrate the impact of this component, a company in New England with an average employee age of 40 and hourly workers making $40,000 per year would be expected, other components kept equal, to add another $1,700 per employee above the basic ($1,300) amount from Part I. The same group aged 60 years would be expected to have $3,400 per employee due to demographics and labor pool.
| Non-Modifiable | North East, Hourly Workers, Age 40 | Same group, but average age 60 |
| Basics and bad luck, for a young, healthy workforce | $1,300 | $1,300 |
| Demographics and labor pool | $1,700 | $3,400 |
| Total Non-Modifiable | $3,000 | $4,700 |
Non-Modifiable Total
These two components can vary, as we see, from under $1,300 in our "lowest cost" situation (the young, male 20-somethings), to $4,700 for the aging group. In a typical large company, the non-modifiable total often sits in the $2,500 to $3,500 range. However, full costs for these companies often range from under $4,000 to almost $7,000 per person per year! If basic costs, bad luck, labor pool and demographics only account for about 60%, where does the rest of the cost come from?
Modifiable Parts
By modifiable, we mean something that can be altered by the individual, and/or influenced by the employer. Above, we categorized demographics as non-modifiable because you cannot change them unless you change who you hire or where you locate your company. Modifiable factors are those you can theoretically change in the people you already have.
Part III: Health Status
In general, when health declines, costs go up. Naturally, we put this component in the "modifiable" section of cost, because each of us can decide to what degree we avoid risk and protect our health.
Once again, to isolate the influence of health, the analysis held constant basic needs, bad luck, demographics, and labor pool factors described above. The results indicate that a 10% improvement in health will influence and reduce costs by about the same proportion, between 7-11%.
In other words:
- A 10% improvement in self-reported health status (a 10% shift to a higher score on a scale of poor to excellent) correlated with combined medical and disability cost decrease of approximately the same amount, 9%.
- A 10% decrease in the number of diagnoses people have correlated to a medical and disability cost difference of 11%.
- A 10% decrease in the number of medications people receive resulted in a medical and absence cost difference of 7%.
For those who want a more technical explanation ... these analytic models tell us that when health-related metrics indicate a population is 10% healthier, they will be about 10% less costly. If the population is 20% healthier, we would expect them to be 20% less costly.
Let's do the math. If a group has non-modifiable costs (from Part I & II) of around $4,500 per employee, their total costs could be $4,050 — 10% less — if they had 10% better health status than average people of that age, gender, or location, etc.
On one hand, this validates what we all know: if we live healthy lifestyles and avoid many of the preventable illnesses we develop as we age, we will feel better and cost less. On the other hand, if improving health status by 10% would reduce costs by about 10%, what else might a company do to manage costs?
Part IV: Business Practices
The final component of health care and absence costs is often overlooked: business practices. They are both modifiable and significant. What are they? Business practices are the entire set of employee policies and practices captured in everyone's workplace environment and employment contract — such as how compensation works, how health benefits are structured, how time off is allotted, how employees are trained and managed, etc. More often than not, these factors have a stronger influence on cost than health status. However, the magnitude of business practices' influence on employee behavior catches most people off-guard.
The bottom line: business practices can have three times the impact on cost as health status.
If business practices matter so much, why haven't we heard about them before?
Actually, you probably have, just not in combination. Most of these effects are well-documented.
- Actuaries have decades of evidence showing the impact of deductibles and copayments; however, they are usually seen as differences in cost-sharing arrangements rather than behavioral incentives (2, 3).
- Management and compensation journals highlight many ways in which financial or other rewards impact worker performance and withdrawal, i.e. absence (4, 5).
- Risk-management professionals understand that worker satisfaction influences the rate of accident and injury (6).
- Disability carriers clearly understand the relationship between insurance policy design (i.e., salary reimbursement) and the rate of claim submission (7).
- Experts in talent development know what sorts of advancement opportunities help an organization keep and motivate its top workers.
- Health economists have documented the use-it-or-lose it phenomenon of both sick leave and annual deductibles (8, 9).
The evidence is everywhere, but each piece of it typically remains stuck in separate fields. Because this information is so seldom captured and integrated from so many different sources, the impact of independent cost drivers has been nearly impossible to measure, until now.
Economics Tell Us That Incentives Matter
Simply put, if we align business practices such that employees can earn more rewards for being more productive and get extra value by avoiding absences, both are more likely to happen, no matter what the health status of the group. On the contrary, if employees perceive little reward for higher productivity and have to take absence days in order to avoid "losing" them, workers are more likely to be absent, regardless of their overall health status.
Thus, the full array of business practices, including aligned compensation, benefit design, training, and management practices can influence health care and disability costs by as much as 30% or 40% compared to misaligned business practices. Remember, improving health status (Part III) by 10% only produces a 10% cost improvement opportunity.
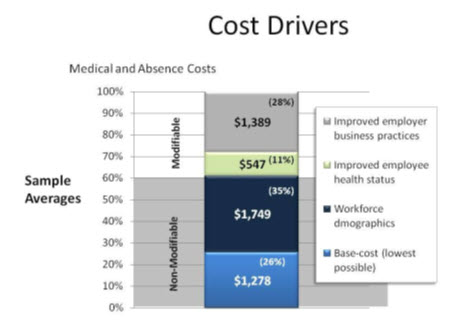
A typical example is shown in the figure below where medical and absence costs are separated along the lines of the categories discussed above. This is a hypothetical company having typical business practices commonly seen in large corporations. As expected, there is a significant cost component attributed to Basic Costs and Workforce Demographics (Parts I & II). Also notice that there is potential to reduce costs through a 10% health status improvement (Part III). But of critical importance, our models indicate that the vast majority of their modifiable costs, which account for 39% overall, are attributable to their business practices (28%).
While the effect of business practices may seem large, in some cases up to 40%, recall that we are talking about a combination of many different business practices. In the RAND health insurance experiment, the effect of a larger deductible by itself was a 40% difference in medical costs (2). Here the category of business practices includes all policies and incentives governing health care coverage, paid time-off, compensation, disability, training, retirement and other factors. Given the cumulative influence of all these incentives combined, we should not be surprised that their sum is dramatic.
Which business practices matter most? The truth is they act in combination because they are interrelated in fundamental ways. The easy answer is that we need to align them all. But which one is most important for a given organization depends on what they are already doing right. Compensation design influences benefit use, absence policies influence medical costs, training practices influence turnover, and so on. In other words: cost drivers that are sometimes considered to be non-modifiable (in the sense that they are immutable) are really influenced by the modus operandi (management practices) of the business and therefore can be modified.
Indeed there is evidence about specific business, such as:
- PTO plans and buy-back plans (versus strict sick leave) improve attendance (10).
- Variable pay plans improve retention (11), absence and benefits use (12).
- High deductibles combined with fully-funded HSA plans reduce costs and improve health protection (10).
Also, our research confirms that aligned business practices are predictive not only of benefit costs, but also productivity and turnover.
All aspects of human capital management are connected. How you reward, train, and manage people has a stronger effect on health care costs, absence, and productivity than many people think. Business practices are a critical consideration that points to affordable solutions that have a demonstrable effect on business performance. Further, if a company's sole strategy for controlling medical and disability costs is focused on health improvement or value-based purchasing strategies, the largest potential for cost savings will be missed.
Employers invest billions of dollars in health improvement and health management to try to control costs, yet many overlook an even larger opportunity to reduce benefit costs by aligning incentives with their business practices in ways that do not require additional investments. Ignoring such obvious opportunities leaves huge potential for business performance unrealized.
1 This brief discussion focuses only on "demand-side" components of cost; it does not address how the supply-side (meaning differences across providers) affects costs, although this phenomenon is very real. To some degree it is included in regional differences, but it must be acknowledged as a factor not included here.
References
- Lynch W, Gardner H. Who Survives? How Benefit Costs are Killing Your Company. Cheyenne, Wyoming: Health as Human Capital Foundation; 2011.
- Newhouse JP. Free for all? Lessons from the RAND Health Insurance Experiment: Harvard University Press; 1996.
- Manning WG, Newhouse JP, Duan N, Keeler EB, Leibowitz A, Marquis MS. Health insurance and the demand for medical care: evidence from a randomized experiment. The American economic review. 1987;77(3):251-77. Epub 1987/05/10.
- Lazear EP. Performance Pay and Productivity. American Economic Review. 2000;90(5):1346-61.
- Trevor CO, Gerhart B, Boudreau JW. Voluntary turnover and job performance: curvilinearity and the moderating influences of salary growth and promotions. J Appl Psychol. 1997;82(1):44-61.
- Butler RJ, Johnson WG, Cote P. It pays to be nice: employer-worker relationships and the management of back pain claims. J Occup Environ Med. 2007;49(2):214-25. Epub 2007/02/13.
- Lynch WD, Gardner HH. Blog 3.2: Money matters in decisions about disability. Aligning Incentives, Information, and Choice: How to Optimize Health and Human Capital Performance. Cheyenne, Wyoming: Health as Human Capital Foundation; 2008. p. 78-9.
- Keeler EB, Rolph JE. The demand for episodes of treatment in the health insurance experiment. Journal of health economics. 1988;7(4):337-67.
- Ehrenberg RG, Ehrenberg RA, Rees DI, Ehrenberg EL. School District Leave Policies, Teacher Absenteeism, and Student Achievement. Journal of Human Resources. 1991;26(1):72-105.
- Lynch WD, Gardner HH. Blog 8.3: PTO Banks and health savings accounts---small steps toward shared economic incentives. Aligning Incentives, Information, and Choice: How to Optimize Health and Human Capital Performance. Cheyenne, Wyoming: Health as Human Capital Foundation; 2008. p. 212-6.
- Lynch W. A study of what makes high performers stay. Entry 10. Health as Human Capital Foundation Blog [Internet]. 2006. Available from: http://www.hcmsgroup.com/2006/05/.
- Lynch W. Aligning Incentives: What do bonuses have to do with reducing absence? More than you might think. Entry 2 Health as Human Capital Foundation Blog [Internet]. 2008. Available from: http://www.hcmsgroup.com/2008/01/.