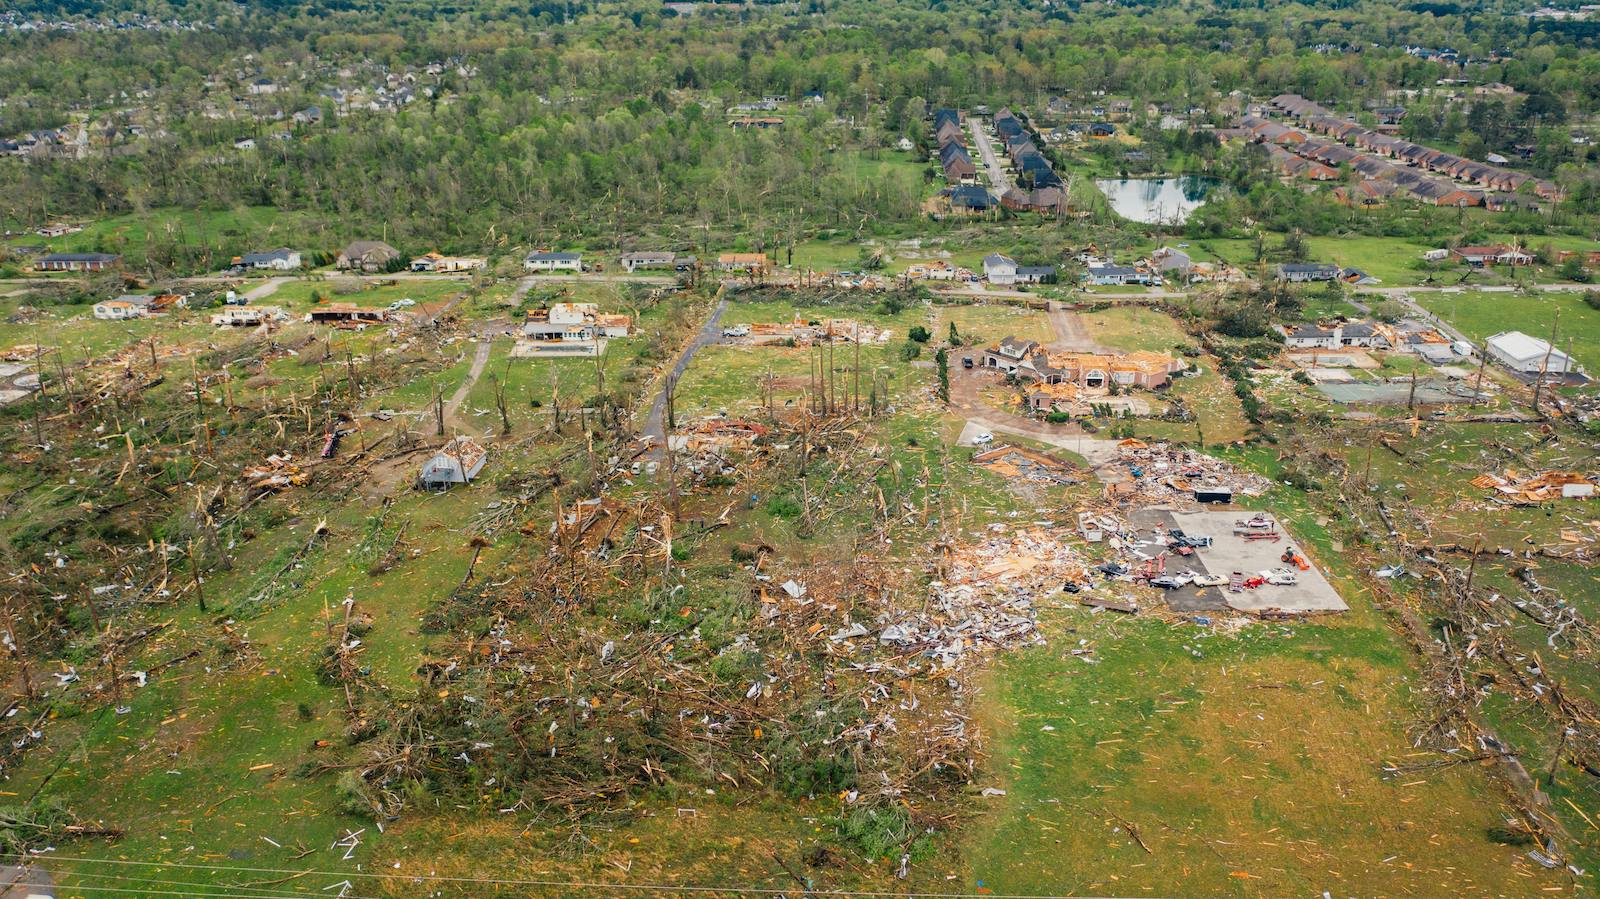
Storms of unprecedented power have lashed the U.S. and the Caribbean in recent years, leaving a trail of devastation estimated in the tens of billions of dollars. The U.S. alone has experienced 212 natural disasters since 1980 with the overall costs totaling $1.2 trillion, according to the National Oceanic and Atmospheric Association (NOAA).
As a venture investor interested in fintech, I get sight of quite a lot of innovative insurtech startups hoping to be the next big thing in insurance. Barely any of these businesses are focused on improving claims management. Why is that?
Perhaps claims are considered the least sexy aspect of the insurance industry, a necessary evil if you like. Good insurers understand the claims experience is one of the most important parts of insurance. Insurance, after all, is a promise to make good your losses in case of an accident.
Natural disasters are brutal. They leave people vulnerable and exposed, and a speedy resolution by the insurer is crucial to the customer experience, encourages customer retention and also saves the insurer time and money.
That’s an easy thing to say, but dynamically responding to claims after events of the magnitude of Hurricanes Harvey and Irma is no mean feat. It’s often impossible for people to access the areas for quite some time, by which point storm surges have subsided, and claims can be harder to assess.
One company addressing this challenge for insurers is Geospatial Insight. VenturesOne recently announced a growth equity investment in the company, and I was with their team in the U.K. They had just delivered incredibly detailed visual intelligence on Hurricane Harvey to enable insurers and their corporate clients to understand the situation at ground level and respond swiftly to claims.
There are three main challenges that an insurer can address by adopting visual intelligence services after a natural disaster:
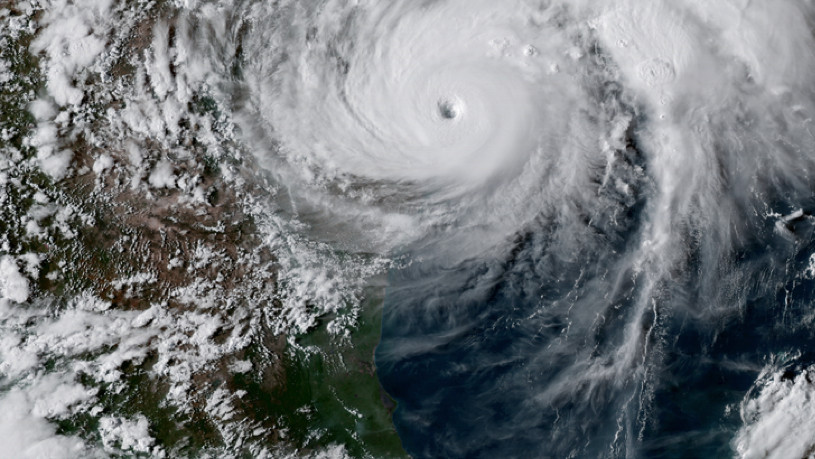 Harvey causes catastrophic flooding, with 50-plus inches of rainfall in some areas (a record from a tropical cyclone in the U.S.). Harvey covers over 20,000 square miles in 72 hours, displacing 30,000 people.
See also: Hurricane Harvey’s Lesson for Insurtechs
Situational Analysis
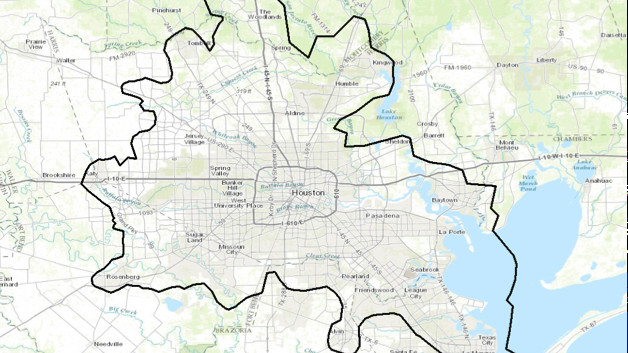
The first step was to make an initial assessment of the affected area and a rapid review of expected requirements by insurance clients. The densely populated residential and commercial area of greater Houston was set.
Harvey causes catastrophic flooding, with 50-plus inches of rainfall in some areas (a record from a tropical cyclone in the U.S.). Harvey covers over 20,000 square miles in 72 hours, displacing 30,000 people.
See also: Hurricane Harvey’s Lesson for Insurtechs
Situational Analysis
The first step was to make an initial assessment of the affected area and a rapid review of expected requirements by insurance clients. The densely populated residential and commercial area of greater Houston was set.
 Big Data Collection, Processing and Analytics
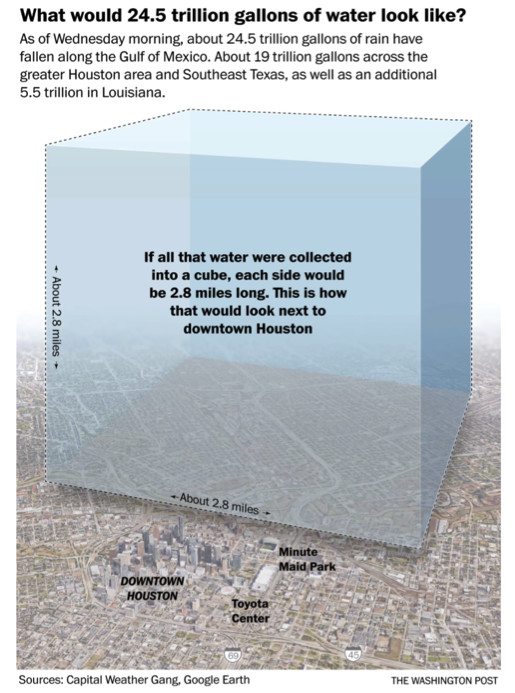
Although Harvey made landfall on Friday, the weather event continued with torrential rainfall throughout the days that followed. By Wednesday, the 30th, it is estimated that a mind-boggling 24.5 trillion gallons of rainwater was dumped from the Gulf of Mexico across Houston and Southern Texas.
Big Data Collection, Processing and Analytics
Although Harvey made landfall on Friday, the weather event continued with torrential rainfall throughout the days that followed. By Wednesday, the 30th, it is estimated that a mind-boggling 24.5 trillion gallons of rainwater was dumped from the Gulf of Mexico across Houston and Southern Texas.
 To get the most comprehensive understanding possible, a diverse variety of data sets were collated, including terrain data, satellite imagery, drone footage from social media scrapes and independent commissioned light aircraft with specialist high-resolution camera imagery.
The team used the data collected from aerial and social to calibrate the threshold used to generate the sentinel footprint. Geospatial Insight then use proprietary algorithms to cluster the areas detected as water into flooded areas.
To get the most comprehensive understanding possible, a diverse variety of data sets were collated, including terrain data, satellite imagery, drone footage from social media scrapes and independent commissioned light aircraft with specialist high-resolution camera imagery.
The team used the data collected from aerial and social to calibrate the threshold used to generate the sentinel footprint. Geospatial Insight then use proprietary algorithms to cluster the areas detected as water into flooded areas.
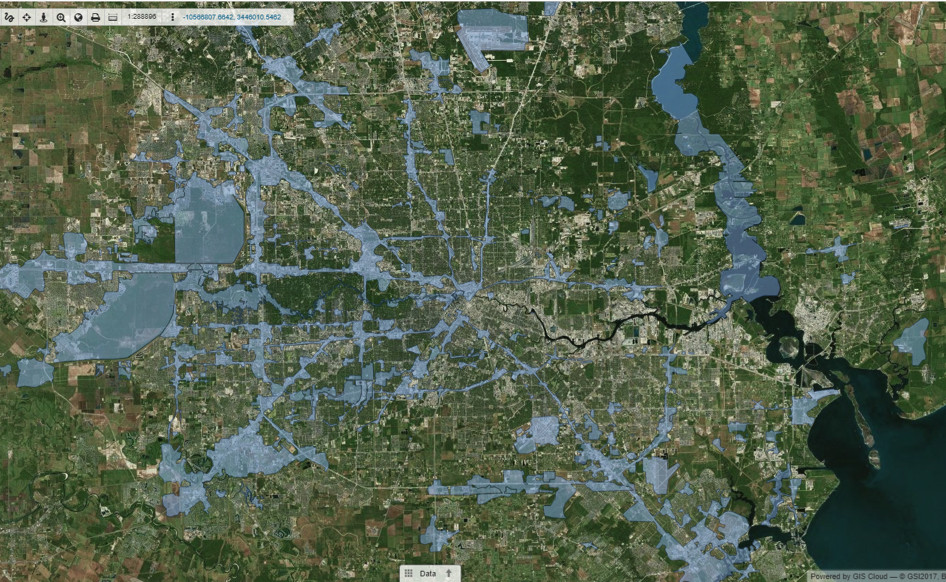 To understand the likely impact of Harvey on homes and commercial buildings, the multiple data sets were combined to gain insight into flood extents. The color-coded image below shows different data sources.
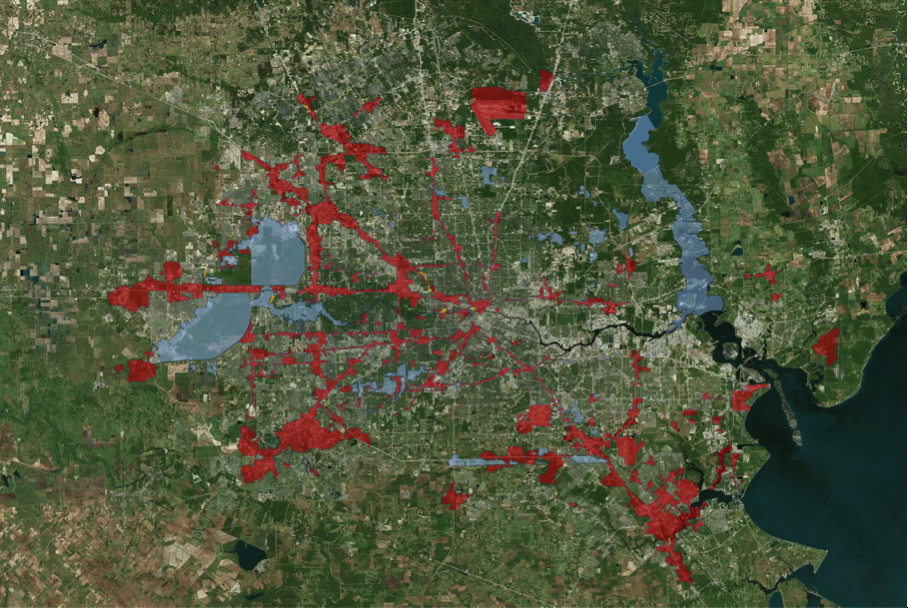 The blue is derived from the National Oceanic and Atmosphere Association (NOAA) imagery and an aerial survey using a Midas oblique camera system.
The red is Sentinel 1 radar satellite that can penetrate cloud cover to identify areas of standing water.
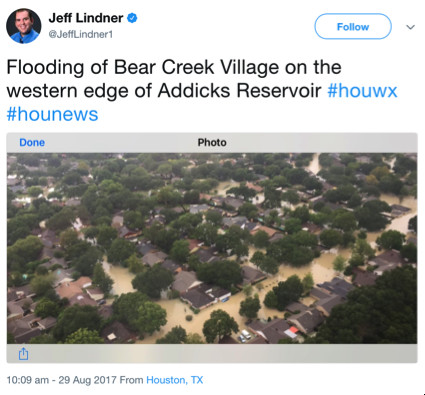
The small pockets of yellow are derived from Geospatial Insight’s social media scraping tool to find photos and videos of the event, which can then be mapped to build the extents from video evidence. Typically, the team use their global network of licensed UAV operators that work to agreed SLA’s to map flood areas with drones, however, drones were banned over Houston during this time frame due to emergency services using the airspace for rescues, etc.
Footage like the example below were identified, then the flight path and flood extents expertly mapped.
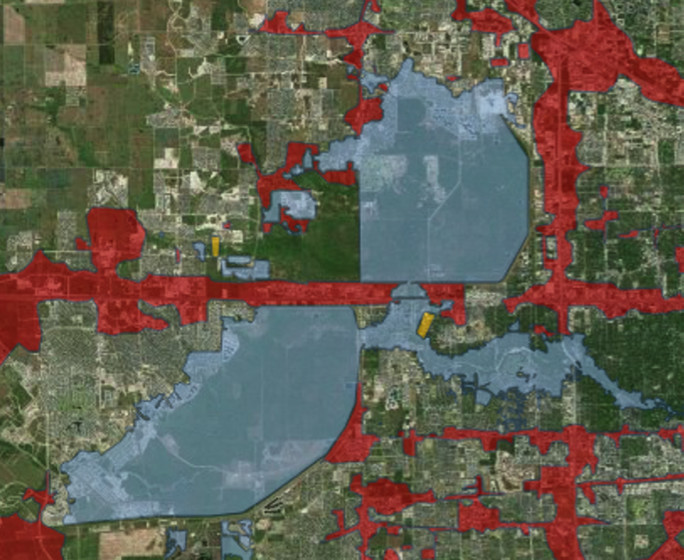
Why was the flooding so severe?
You can clearly see the two large blue reservoirs on the west side of Houston, Addicks to the north of Interstate 10 and Barker to the south. They are designed to protect Houston from flooding, and both dams feed into the Buffalo Bayou. The reservoirs are surrounded by parks and residential areas, and by Monday evening water levels had already reached record levels, measuring 105 feet at Addicks (north) and 99 feet at Barker (south).
The blue is derived from the National Oceanic and Atmosphere Association (NOAA) imagery and an aerial survey using a Midas oblique camera system.
The red is Sentinel 1 radar satellite that can penetrate cloud cover to identify areas of standing water.
The small pockets of yellow are derived from Geospatial Insight’s social media scraping tool to find photos and videos of the event, which can then be mapped to build the extents from video evidence. Typically, the team use their global network of licensed UAV operators that work to agreed SLA’s to map flood areas with drones, however, drones were banned over Houston during this time frame due to emergency services using the airspace for rescues, etc.
Footage like the example below were identified, then the flight path and flood extents expertly mapped.
Why was the flooding so severe?
You can clearly see the two large blue reservoirs on the west side of Houston, Addicks to the north of Interstate 10 and Barker to the south. They are designed to protect Houston from flooding, and both dams feed into the Buffalo Bayou. The reservoirs are surrounded by parks and residential areas, and by Monday evening water levels had already reached record levels, measuring 105 feet at Addicks (north) and 99 feet at Barker (south).
 Local officials hoped to prevent a spill-over by slowly releasing water from both the Addicks and Barker dams on Tuesday and Wednesday. However, the storm surge was so great that the engineers had to release water through the dam gates much earlier than expected or risk it spilling over and causing further damage to homes. A warning was given to homes to evacuate in the early hours of Monday morning, but the decision was made to release the pressure late Sunday night, and many residents became stranded in the resulting swell.
 Accelerating Claims with Visual Intelligence
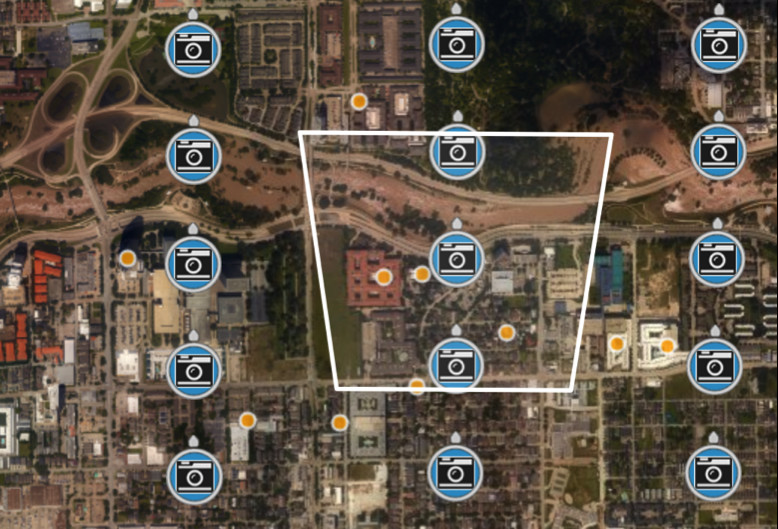
To provide the intelligence required to rapidly address insurance claims, the Geospatial Insight team needed to first make sense of huge amounts of unstructured data. Not only the diverse image sources but also client information for insurance customers and corporate responsibility data like home addresses of employees to map the affected customers and staff.
This data was quickly mapped and the multiple image sources applied as layers to allow corporate clients to access and make sense of the information via Geospatial Insights' dedicated customer portal.
Accelerating Claims with Visual Intelligence
To provide the intelligence required to rapidly address insurance claims, the Geospatial Insight team needed to first make sense of huge amounts of unstructured data. Not only the diverse image sources but also client information for insurance customers and corporate responsibility data like home addresses of employees to map the affected customers and staff.
This data was quickly mapped and the multiple image sources applied as layers to allow corporate clients to access and make sense of the information via Geospatial Insights' dedicated customer portal.
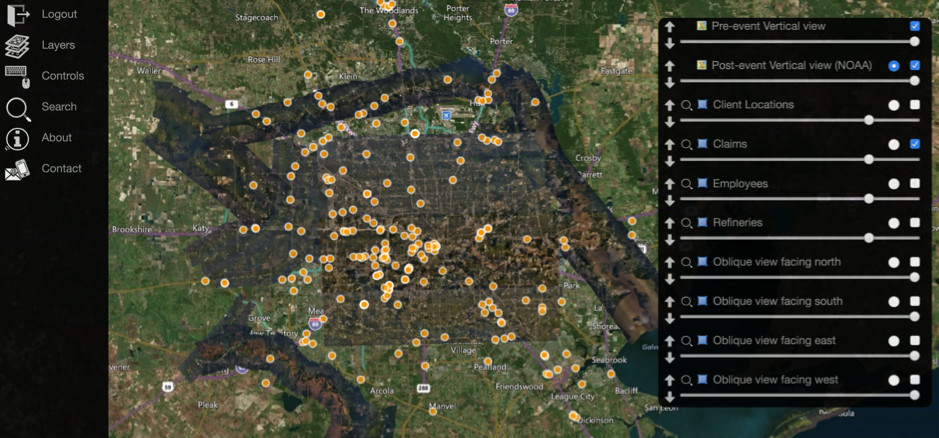 The image above shows the client portal with claim location points identified in yellow.
High-resolution satellite images can be a good indicator, but they are a top-down view, so it is much harder to get an accurate perspective on the level of damage on a property. Images at an oblique angle were needed to help quantify this over a vast area, and thus Geospatial Insight commissioned a light aircraft equipped with a Midas 5 camera to map the most-affected region for high-resolution imagery.
See also: Preparing for the 2019 Hurricane Season
The visualization below shows how this camera is able to capture oblique angles in four directions simultaneously (along with an overhead view).
The image above shows the client portal with claim location points identified in yellow.
High-resolution satellite images can be a good indicator, but they are a top-down view, so it is much harder to get an accurate perspective on the level of damage on a property. Images at an oblique angle were needed to help quantify this over a vast area, and thus Geospatial Insight commissioned a light aircraft equipped with a Midas 5 camera to map the most-affected region for high-resolution imagery.
See also: Preparing for the 2019 Hurricane Season
The visualization below shows how this camera is able to capture oblique angles in four directions simultaneously (along with an overhead view).
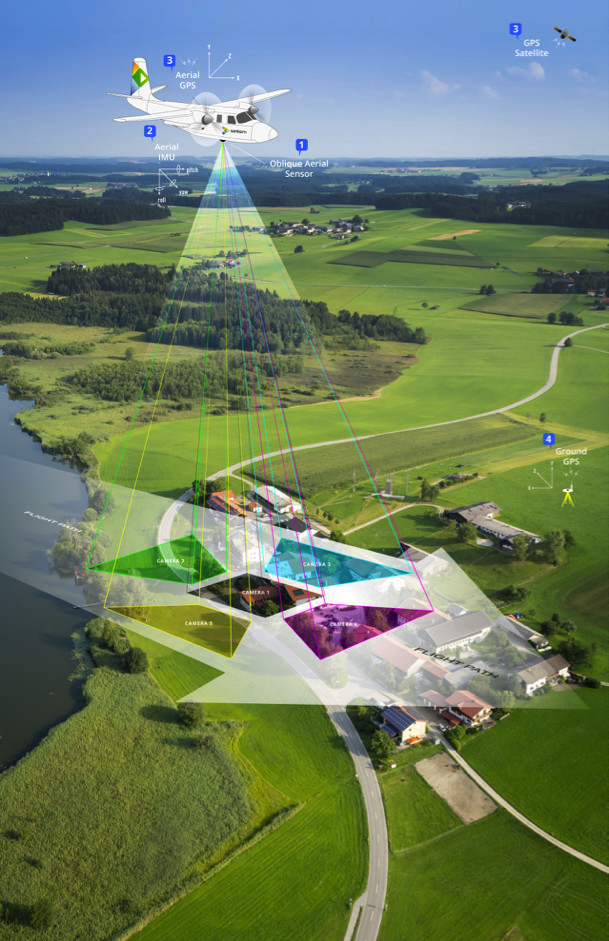 Using this technique, huge areas could be imaged in high resolution and then mapped to provide oblique angled images in North, South, East and West orientations for accurate analysis of identified claim locations.
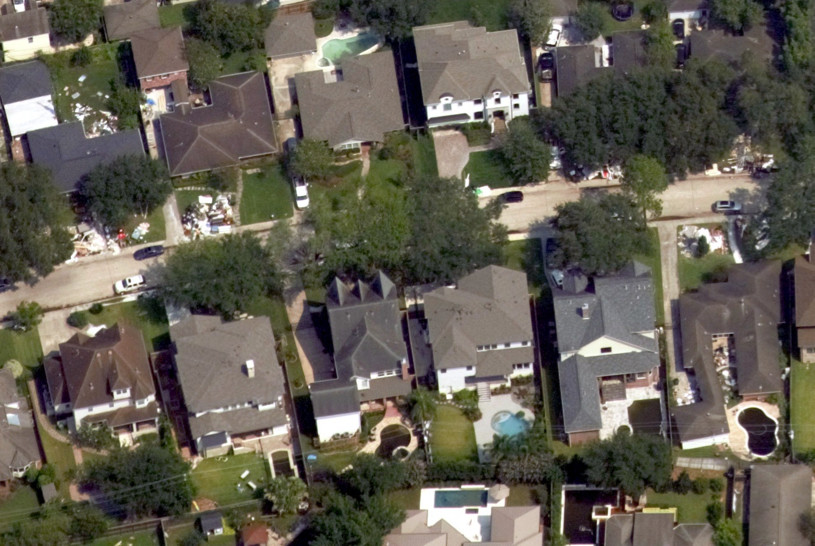
 With this resolution and volume of data, the Geospatial Insight team could identify the evidence of flooding such as remaining water, sediment and waste outside houses even after the flooding drained away. Below is an example image showing home furnishings being disposed of. You can clearly see the raised swimming pools that remained clean and blue compared with those that were ruined by the storm surge.
 Rebuilding Lives After Disaster
Sadly, it seems many residents of Houston were uninsured and face rebuilding their lives without any form of insurance payout. For those with cover, getting access to funds quickly will make all the difference.
By embracing the kind of technology used in Hurricane Harvey, insurers can make a meaningful difference in helping residents, businesses and communities get back on their feet as quickly as possible.
Rebuilding Lives After Disaster
Sadly, it seems many residents of Houston were uninsured and face rebuilding their lives without any form of insurance payout. For those with cover, getting access to funds quickly will make all the difference.
By embracing the kind of technology used in Hurricane Harvey, insurers can make a meaningful difference in helping residents, businesses and communities get back on their feet as quickly as possible.
- The approximate total claim size likely as a result of the event.
- An accurate map of the area affected by the event, to prevent fraudulent claims.
- That the proximate cause of the claim is directly related to the event.
Harvey causes catastrophic flooding, with 50-plus inches of rainfall in some areas (a record from a tropical cyclone in the U.S.). Harvey covers over 20,000 square miles in 72 hours, displacing 30,000 people.
See also: Hurricane Harvey’s Lesson for Insurtechs
Situational Analysis
The first step was to make an initial assessment of the affected area and a rapid review of expected requirements by insurance clients. The densely populated residential and commercial area of greater Houston was set.
Big Data Collection, Processing and Analytics
Although Harvey made landfall on Friday, the weather event continued with torrential rainfall throughout the days that followed. By Wednesday, the 30th, it is estimated that a mind-boggling 24.5 trillion gallons of rainwater was dumped from the Gulf of Mexico across Houston and Southern Texas.
To get the most comprehensive understanding possible, a diverse variety of data sets were collated, including terrain data, satellite imagery, drone footage from social media scrapes and independent commissioned light aircraft with specialist high-resolution camera imagery.
The team used the data collected from aerial and social to calibrate the threshold used to generate the sentinel footprint. Geospatial Insight then use proprietary algorithms to cluster the areas detected as water into flooded areas.
To understand the likely impact of Harvey on homes and commercial buildings, the multiple data sets were combined to gain insight into flood extents. The color-coded image below shows different data sources.
The blue is derived from the National Oceanic and Atmosphere Association (NOAA) imagery and an aerial survey using a Midas oblique camera system.
The red is Sentinel 1 radar satellite that can penetrate cloud cover to identify areas of standing water.
The small pockets of yellow are derived from Geospatial Insight’s social media scraping tool to find photos and videos of the event, which can then be mapped to build the extents from video evidence. Typically, the team use their global network of licensed UAV operators that work to agreed SLA’s to map flood areas with drones, however, drones were banned over Houston during this time frame due to emergency services using the airspace for rescues, etc.
Footage like the example below were identified, then the flight path and flood extents expertly mapped.
Why was the flooding so severe?
You can clearly see the two large blue reservoirs on the west side of Houston, Addicks to the north of Interstate 10 and Barker to the south. They are designed to protect Houston from flooding, and both dams feed into the Buffalo Bayou. The reservoirs are surrounded by parks and residential areas, and by Monday evening water levels had already reached record levels, measuring 105 feet at Addicks (north) and 99 feet at Barker (south).
Local officials hoped to prevent a spill-over by slowly releasing water from both the Addicks and Barker dams on Tuesday and Wednesday. However, the storm surge was so great that the engineers had to release water through the dam gates much earlier than expected or risk it spilling over and causing further damage to homes. A warning was given to homes to evacuate in the early hours of Monday morning, but the decision was made to release the pressure late Sunday night, and many residents became stranded in the resulting swell.
Accelerating Claims with Visual Intelligence
To provide the intelligence required to rapidly address insurance claims, the Geospatial Insight team needed to first make sense of huge amounts of unstructured data. Not only the diverse image sources but also client information for insurance customers and corporate responsibility data like home addresses of employees to map the affected customers and staff.
This data was quickly mapped and the multiple image sources applied as layers to allow corporate clients to access and make sense of the information via Geospatial Insights' dedicated customer portal.
The image above shows the client portal with claim location points identified in yellow.
High-resolution satellite images can be a good indicator, but they are a top-down view, so it is much harder to get an accurate perspective on the level of damage on a property. Images at an oblique angle were needed to help quantify this over a vast area, and thus Geospatial Insight commissioned a light aircraft equipped with a Midas 5 camera to map the most-affected region for high-resolution imagery.
See also: Preparing for the 2019 Hurricane Season
The visualization below shows how this camera is able to capture oblique angles in four directions simultaneously (along with an overhead view).
Using this technique, huge areas could be imaged in high resolution and then mapped to provide oblique angled images in North, South, East and West orientations for accurate analysis of identified claim locations.
With this resolution and volume of data, the Geospatial Insight team could identify the evidence of flooding such as remaining water, sediment and waste outside houses even after the flooding drained away. Below is an example image showing home furnishings being disposed of. You can clearly see the raised swimming pools that remained clean and blue compared with those that were ruined by the storm surge.
Rebuilding Lives After Disaster
Sadly, it seems many residents of Houston were uninsured and face rebuilding their lives without any form of insurance payout. For those with cover, getting access to funds quickly will make all the difference.
By embracing the kind of technology used in Hurricane Harvey, insurers can make a meaningful difference in helping residents, businesses and communities get back on their feet as quickly as possible.