
As customers press insurers for the best possible rates -- especially in the wake of COVID-19 -- companies must map their position against competitors to be able to offer optimal prices. The market offers several online tools and platforms to compare general insurance quotes based upon the details that prospective customers provide. However, for insurers that wish to compare their quotes with competing products in the market, not just in terms of price but in terms of attributes such as coverage and benefits, these platforms and tools are insufficient.
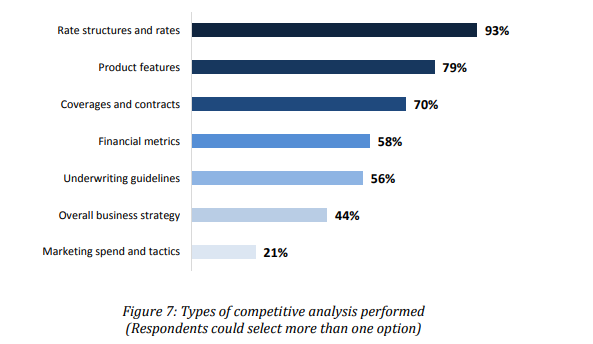
A 2015 survey by Earnix of North American insurers engaged in personal lines, almost every company surveyed (93%) performs rate structure and rate competitive analysis. Other common types of competitive analysis include product features (79%), coverages and contracts (70%), financial metrics (58%) and underwriting guidelines (56%).
To perform such multifold comparisons, insurers require access to a business intelligence solution that is interactive and allows users to analyze across different consumer segments and product/policy features. Such a business intelligence (BI) tool should not only be capable of extracting the quote information from various raters/agents/online-platforms/competitors but also consolidate this information so insurers can compare other metrics, by:
- Providing a clear understanding of the standing of client vs. competitor quote, by dollar amount.
- Generating insights to develop predictive models that can assist in increasing the conversion rates of policies.
- Focusing on the binding and issue rates, to measure success.
- Assisting in cross-selling, marketing and targeting of customers from other lines of business.
This article provides a framework for developing a quote comparison BI solution and contains metrics for assessing competitiveness across multiple lines of business.
DISCLAIMER: Because insurance consumers often purchase home and auto insurance at the same time, while building a quote comparison BI solution it is essential to include the competitiveness of both lines together by combining multiple line of business reports into one. This entails setting up specific data warehousing processes in the background, which are needed to power up the visualizations in the dashboard/report output.
Key Metrics to Use in This Rating Methodology
An insurer trying to compare the pricing of its competitors needs to establish a set of metrics to rank different quotes for a given consumer profile, created by analyzing past policy purchases and consumer details data collected by brokers.
One of the several challenges is that the competitiveness information received for quotes belongs to a single business line. This information is sometimes categorized and not in absolute numbers. In most cases, a carrier gets the following values directly: its premium, low/median/high carrier premiums and rank for a quote. Thus, there is a problem with joining auto and the home quotes to form a combined quote.
While a carrier can determine its own combined premium (auto premium + home premium), it cannot do the same for the low/median/high carrier premium info. For instance, one does not know whether the carrier that quoted the lowest auto premium is the same carrier that quoted the lowest home premium. In fact, the combined low premium (set to low auto + low home) is, in most cases, going to be lower than the actual combined low premium. The opposite is true for combined high premium info; the estimate will uniformly be higher than the true high combined premium. The combined median should be higher than the actual combined median just as often as it is lower, so the overall median combined premium should be roughly in line with the actual combined medians.
The carrier performing the rate comparison can use different approaches to determine the best estimate of all the competitiveness measures used in the views of a single line of business. Some of the metrics used in this approach are:
- Ranks based on the premium dollar value quoted for both auto/home.
- Categories based on the ranks where the insurer is No. 1 in a category, and rank sorting among the top few ranks.
- Number of carriers quoted for that policy.
- Difference in premium dollar value quoted for both auto/home and the low/median/average/high of all the premiums quoted.
- The average rank based on premium dollar value quoted for each line of business.
- Percentage of quotes issued. Issuing is the act of completing a quote and binding a policy (generating a policy number). The issue percentage (issue rate/close rate) is the percentage of quotes in which a policy is issued at the end.
See also: Best AI Tech for P&C Personal Lines
Ranking Insurance Quotes
The ranks given to competitors do not have the information about the number of competitors quoting for a given consumer persona (or a consumer). P&C carriers can adapt a new ranking methodology that identifies the most robust metric that combines rank with the number of carriers quoting for a given consumer persona/profile. For example, consider a scenario where a customer gets three auto insurance quotes from his independent agent. Here, to be ranked second isn’t as impressive as being ranked second out of 10 quotes. The following three rules can be used by carriers when determining ranks in their dashboards:
Expected win rate: Expected proportion of Rank 1 quotes.
Rank scale metric: This is essentially distance from “expected win rate.”
LOB filters constraint rule: Consider an insurance carrier offering home and auto and wanting to be able to offer them alone or in combination. The BI solution for price and rank comparison should provide filters for visualizing such combinations.
Analysis and comparisons
Geography-Level Analysis
One can showcase metrics like numbers of quotes and conversion rates, etc. Analysts have access to line of business and geography-level filters like state and county, urban vs rural, etc.
Rank Level Analysis
Here one can show product performance based on ranks for different lines of business for metrics like quote vs. pre-quote.
Line of Business Analysis
Each line of business has specific attributes -- for example, driver age and vehicle age for auto insurance -- so one needs line-of-business-level views for auto and home and a combined graph.
Competitive Market Analysis
This involves relative quote ranking to understand the insurer position concerning competitors, analysis around quote distance from average market price and segmentation analysis to understand which insurers are incredibly expensive.
Price Elasticity Analysis
This focuses on price sensitivity and customer profile. Segmentation analysis helps understand the pace at which the rates can increase or decrease to accept the change. Similarly, different studies can be carried out for the sales and marketing team to increase the retention of profitable customer segments.
Price Optimization
Price optimization is more of a prescriptive analytics approach. A scenario-based analysis can help check price sensitivity by market segments and build a reusable platform for carrying out state and countrywide optimization analysis.
Quote & Coverage Optimization and Customer Segmentation
An insurer may not offer the best price but may still bind the policy because of better coverages, or the insurer may have the best price but not win the business. These are the scenarios that a carrier needs explicitly to look into as they will help the carrier while quoting new customers.
Location-Based Analysis
Location has a significant effect on premiums. Differences in competition, state and local rules and cost of living account for this. Insurers take into consideration this information when they decide on the premium dollar value. For example, in a region with higher car theft rates, one may pay a higher premium than a place where car theft rates are low.
See also: Foundational Tech for Personal Lines
Conclusion:
With COVID 19, pricing has become more crucial than ever as it can become a great source of competitive advantage. A useful quote comparison tool that encompasses various metrics of comparisons and different data elements can lead to better customer acquisition and retention. The visualizations provide an effective way to stay on top of customers' expectations and price right to keep your organization ahead of competitors. Deploying data analytics to integrate home and auto and customer personas can help deliver the right products and the correct prices to existing and prospective customers.
However, to kick off this transition, it is crucial for insurers to carefully collate a list of metrics to compare, rank the insurance quotes to take into account the number of competitors and then perform the needed analysis. The best way to determine this is through a comprehensive, systematic audit of the current quote comparison process. A carefully planned audit will help insurers to:
- Identify gaps in the current quote comparison process.
- Identify the right personas and the right metrics.
- Prioritize the customer population who are more likely to expand the wallet share and purchase a policy.
- Build a single source of truth of quote information for effective pricing decisions