
Most companies that take up risk management start out with subjective frequency-severity assessments of each of their primary risks. These values are then used to construct a heat map, and the risks that are farthest away from the zero point of the plot are judged to be of most concern.
This is a good way to jump-start a discussion of risks and to develop an initial process for prioritizing early risk management activities. But it should never be the end point for insurers. Insurers are in the risk business. The two largest categories of risks for insurers -- insurance and investment -- are always traded directly for money. Insurers must have a clear view of the dollar value of their risks. And with any reflection, insurance risk managers will identify that there is actually never a single pair of frequency and severity that can accurately represent their risks. Each of the major risks of an insurer has many, many possible pairs of frequency and severity.
For example, almost all insurers with exposure to natural catastrophes have access to analysis of their exposure to loss using commercial catastrophe models. These models produce loss amounts at a frequency of 1 in 10, 1 in 20, 1 in 100, 1 in 200, 1 in 500, 1 in 1000 and any frequency in between. There is not a single one of these frequency severity pairs that by itself defines catastrophe risk for that insurer.
Once an insurer moves to recognizing that all of its risks have this characteristic, it can now take advantage of one of the most useful tools for portraying the risks of the enterprise, the risk profile. For a risk profile, each risk is portrayed according to the possible loss at a single frequency. One common value is a 1 in 100 frequency. In Europe, all insurers are focused by Solvency II regulations on the 1-in-200 loss. Ultimately, an insurer will want to develop a robust model like the catastrophe model for each of its risks to support the development of the risk profile. But before spending all of that money, there are two possible shortcuts that are available to rated insurers that will cost little to no additional money.
SRQ Stress Tests
In 2008, AM Best started asking each rated insurer to talk about its top five risks.
Then, in 2011, in the new ERM section to the supplemental rating questionnaire, Best asked insurers to identify the potential impact of the largest threat for six risk types. For many years, AM Best has calculated its estimate of the capital needed by insurers for losses in five categories and eventually added an adjustment for a sixth -- natural catastrophe risk.
Risk profile is one of the primary areas of focus for good ERM programs and is closely related to these questions and calculations. Risk profile is a view of all the main risks of an insurer that allows management and other audiences the chance to compare the size of the various risks on a relative basis. Often, when insurers view their risk profile for the first time, they find that their profile is not exactly what they expected. As they look at their risk profile in successive periods, they find that changes to their risk profile end up being key strategic discussions. The insurers that have been looking at their risk profile for quite some time find the discussion with AM Best and others about their top risks to be a process of simplifying the detailed conversations that they have had internally instead of stretching to find something to say that plagues other insurers. The difference is usually obvious to the experienced listener from the rating agency.
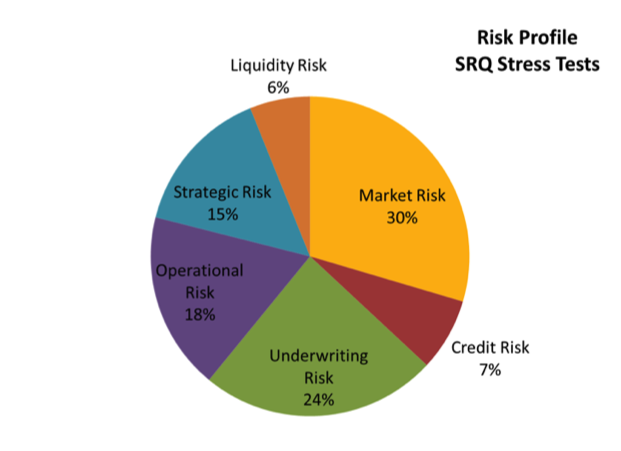
Risk Profile From the SRQ Stress Tests
Most insurers will say that insurance (or underwriting) risk is the most important risk of the company. The chart below, showing information about the risk profile averaged for 31 insurers, paints a very different story. On average, underwriting risk was 24% of the risk profile and market risk was 30%. Twenty of the 31 companies had a higher value for market risk than underwriting risk. For those 20 insurers, this exercise in viewing their risk profile shows that management and the board should be giving equal or even higher amounts of attention to their investment risks.
 Stress tests are a good way for insurers to get started with looking at their risk profile. The six AM Best categories can be used to allow for comparisons with studies, or the company can use its own categories to make the risk profile line up with the main concerns of its strategic planning discussions. Be careful. Make sure that you check the results from the AM Best SRQ stress tests to make sure that you are not ignoring any major risks. To be fully effective, the risk profile needs to include all of the company’s risks. For 20 of these 31 insurers, that may mean acknowledging that they have more equity risk than underwriting risk – and planning accordingly.
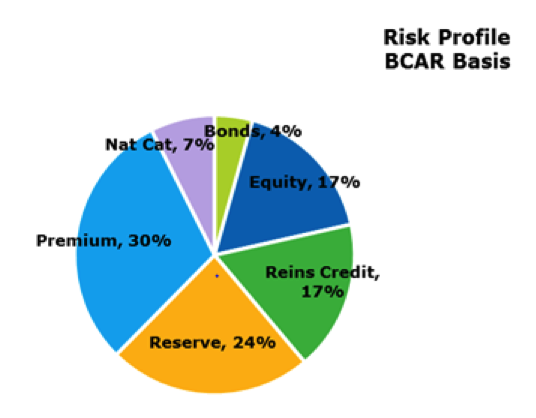
Risk Profile From the BCAR Formula
The chart below portrays the risk profiles of a different group of 12 insurers. These risk profiles were determined using the AM Best BCAR formula without analyst adjustments. For this group of companies on this basis, premium risk is the largest single category. And while there are again six risk categories, they are a somewhat different list. The risk category of underwriting from the SRQ is here split into three categories of premium, reserve and nat cat. Together, those three categories represent more than 60% of the risk profile of this group of insurers. Operational, liquidity and strategic risks that make up 39% of the SRQ average risk profile are missing here. Reinsurer credit risk is shown here to be a major risk category, with 17% of the risk. Combined investment and reinsurer credit is only 7% of total risk in the SRQ risk profile.
Stress tests are a good way for insurers to get started with looking at their risk profile. The six AM Best categories can be used to allow for comparisons with studies, or the company can use its own categories to make the risk profile line up with the main concerns of its strategic planning discussions. Be careful. Make sure that you check the results from the AM Best SRQ stress tests to make sure that you are not ignoring any major risks. To be fully effective, the risk profile needs to include all of the company’s risks. For 20 of these 31 insurers, that may mean acknowledging that they have more equity risk than underwriting risk – and planning accordingly.
Risk Profile From the BCAR Formula
The chart below portrays the risk profiles of a different group of 12 insurers. These risk profiles were determined using the AM Best BCAR formula without analyst adjustments. For this group of companies on this basis, premium risk is the largest single category. And while there are again six risk categories, they are a somewhat different list. The risk category of underwriting from the SRQ is here split into three categories of premium, reserve and nat cat. Together, those three categories represent more than 60% of the risk profile of this group of insurers. Operational, liquidity and strategic risks that make up 39% of the SRQ average risk profile are missing here. Reinsurer credit risk is shown here to be a major risk category, with 17% of the risk. Combined investment and reinsurer credit is only 7% of total risk in the SRQ risk profile.
 Why are the two risk profiles so different in their views about insurance and investment risks? This author would guess that insurers are more confident of their ability to manage insurance risks, so their estimate of that risk estimated in the stress tests is for less severe losses than the AM Best view reflected in the BCAR formula. And the opposite is true for investment, particularly equity risk. AM Best's BCAR formula for equity risk is for only a 15% loss, while most insurers who have a stock portfolio had just in 2008 experienced 30% to 40% losses. So insurers are evaluating their investment risk as being much higher than AM Best believes.
Neither set seems to be the complete answer. From looking at these two groups, it makes sense to consider using nine or more categories: premiums, reserves, nat cat, reinsurer credit, bond credit, equities, operational, strategic and liquidity risk. Insurers with multiple large insurance lines may want to add several splits to the premium and reserve categories.
Using Risk Profile for Strategic Planning and Board Discussions
Risk profile can be the focus for bringing enterprise risk into the company’s strategic discussions. The planning process would start with a review of the expected risk profile at the start of the year and look at the impact on risk profile of any major proposed actions as a part of the evaluation of those plans. Each major plan can be discussed regarding whether it increases concentration of risks for the insurer or if it is expected to increase diversification. The risk profile can then be a major communication tool for bringing major management decisions and proposals to the board and to other outside audiences. Each time the risk profile is presented, management can provide explanations of the causes of each significant change in the profile, whether it be from management decisions and actions or because of major changes in the environment.
Risk Profile and Risk Appetite
Once an insurer has a repeatable process in place for portraying enterprise risk as a risk profile, this risk profile can be linked to the risk appetite. The pie charts above focus attention on the relative size of the main types of risks of the insurer. The bar chart below features the sum of the risks. Here the target line represents the expected sum of all of the risks, while the maximum is an aggregate risk limit based upon the risk appetite.
Why are the two risk profiles so different in their views about insurance and investment risks? This author would guess that insurers are more confident of their ability to manage insurance risks, so their estimate of that risk estimated in the stress tests is for less severe losses than the AM Best view reflected in the BCAR formula. And the opposite is true for investment, particularly equity risk. AM Best's BCAR formula for equity risk is for only a 15% loss, while most insurers who have a stock portfolio had just in 2008 experienced 30% to 40% losses. So insurers are evaluating their investment risk as being much higher than AM Best believes.
Neither set seems to be the complete answer. From looking at these two groups, it makes sense to consider using nine or more categories: premiums, reserves, nat cat, reinsurer credit, bond credit, equities, operational, strategic and liquidity risk. Insurers with multiple large insurance lines may want to add several splits to the premium and reserve categories.
Using Risk Profile for Strategic Planning and Board Discussions
Risk profile can be the focus for bringing enterprise risk into the company’s strategic discussions. The planning process would start with a review of the expected risk profile at the start of the year and look at the impact on risk profile of any major proposed actions as a part of the evaluation of those plans. Each major plan can be discussed regarding whether it increases concentration of risks for the insurer or if it is expected to increase diversification. The risk profile can then be a major communication tool for bringing major management decisions and proposals to the board and to other outside audiences. Each time the risk profile is presented, management can provide explanations of the causes of each significant change in the profile, whether it be from management decisions and actions or because of major changes in the environment.
Risk Profile and Risk Appetite
Once an insurer has a repeatable process in place for portraying enterprise risk as a risk profile, this risk profile can be linked to the risk appetite. The pie charts above focus attention on the relative size of the main types of risks of the insurer. The bar chart below features the sum of the risks. Here the target line represents the expected sum of all of the risks, while the maximum is an aggregate risk limit based upon the risk appetite.
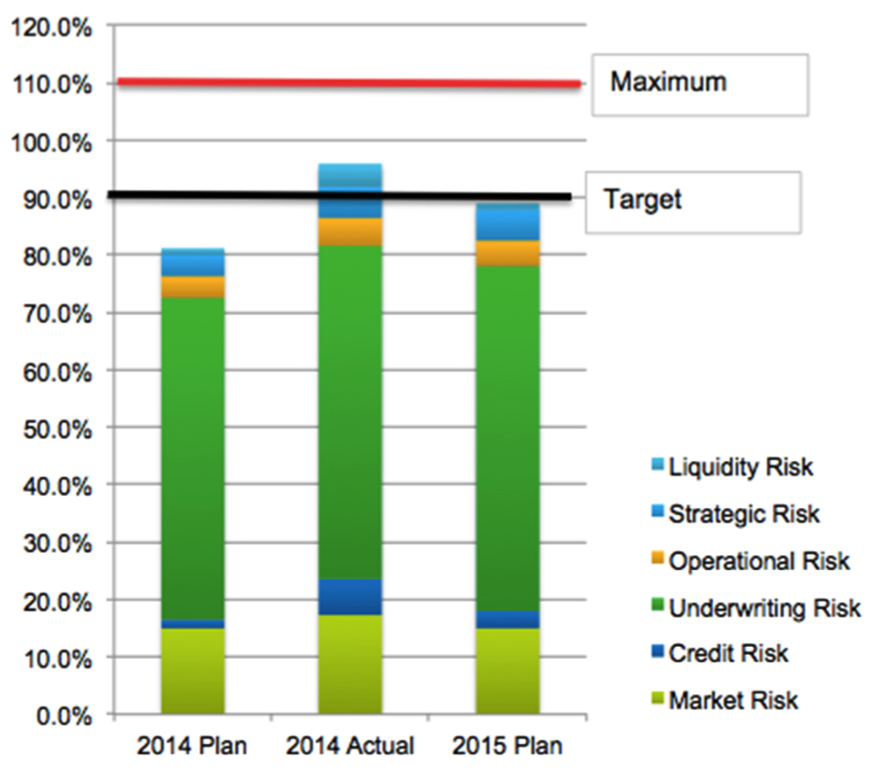 In the example above, the insurer has a target for risk at 90% of a standard (in this case, the standard is for a 400% RBC level; i.e. the target is to have RBC ratio of 440%). The plan is for risk at a level that produces a 480% RBC level, and the maximum tolerance is for risk that would produce a 360% RBC. The 2014 actual risk taking has the insurer at a 420 RBC level, which is above the target but significantly below their maximum. After reviewing the 2014 actual results, management made plans for 2015 that would come in just at the 440% RBC target. That review of the 2014 actual included consideration of the increase in profits associated with the additional risk. When management made the adjustment to reach target for 2015, its first consideration was to reduce less profitable activities. Management was able to make adjustments that significantly improve return for risk taking at a fully utilized level of operation.
Stress tests are a good way for insurers to get started with looking at their risk profile. The six AM Best categories can be used to allow for comparisons with studies, or the company can use its own categories to make the risk profile line up with the main concerns of its strategic planning discussions. Be careful. Make sure that you check the results from the AM Best SRQ stress tests to make sure that you are not ignoring any major risks. To be fully effective, the risk profile needs to include all of the company’s risks. For 20 of these 31 insurers, that may mean acknowledging that they have more equity risk than underwriting risk – and planning accordingly.
Risk Profile From the BCAR Formula
The chart below portrays the risk profiles of a different group of 12 insurers. These risk profiles were determined using the AM Best BCAR formula without analyst adjustments. For this group of companies on this basis, premium risk is the largest single category. And while there are again six risk categories, they are a somewhat different list. The risk category of underwriting from the SRQ is here split into three categories of premium, reserve and nat cat. Together, those three categories represent more than 60% of the risk profile of this group of insurers. Operational, liquidity and strategic risks that make up 39% of the SRQ average risk profile are missing here. Reinsurer credit risk is shown here to be a major risk category, with 17% of the risk. Combined investment and reinsurer credit is only 7% of total risk in the SRQ risk profile.
Why are the two risk profiles so different in their views about insurance and investment risks? This author would guess that insurers are more confident of their ability to manage insurance risks, so their estimate of that risk estimated in the stress tests is for less severe losses than the AM Best view reflected in the BCAR formula. And the opposite is true for investment, particularly equity risk. AM Best's BCAR formula for equity risk is for only a 15% loss, while most insurers who have a stock portfolio had just in 2008 experienced 30% to 40% losses. So insurers are evaluating their investment risk as being much higher than AM Best believes.
Neither set seems to be the complete answer. From looking at these two groups, it makes sense to consider using nine or more categories: premiums, reserves, nat cat, reinsurer credit, bond credit, equities, operational, strategic and liquidity risk. Insurers with multiple large insurance lines may want to add several splits to the premium and reserve categories.
Using Risk Profile for Strategic Planning and Board Discussions
Risk profile can be the focus for bringing enterprise risk into the company’s strategic discussions. The planning process would start with a review of the expected risk profile at the start of the year and look at the impact on risk profile of any major proposed actions as a part of the evaluation of those plans. Each major plan can be discussed regarding whether it increases concentration of risks for the insurer or if it is expected to increase diversification. The risk profile can then be a major communication tool for bringing major management decisions and proposals to the board and to other outside audiences. Each time the risk profile is presented, management can provide explanations of the causes of each significant change in the profile, whether it be from management decisions and actions or because of major changes in the environment.
Risk Profile and Risk Appetite
Once an insurer has a repeatable process in place for portraying enterprise risk as a risk profile, this risk profile can be linked to the risk appetite. The pie charts above focus attention on the relative size of the main types of risks of the insurer. The bar chart below features the sum of the risks. Here the target line represents the expected sum of all of the risks, while the maximum is an aggregate risk limit based upon the risk appetite.
In the example above, the insurer has a target for risk at 90% of a standard (in this case, the standard is for a 400% RBC level; i.e. the target is to have RBC ratio of 440%). The plan is for risk at a level that produces a 480% RBC level, and the maximum tolerance is for risk that would produce a 360% RBC. The 2014 actual risk taking has the insurer at a 420 RBC level, which is above the target but significantly below their maximum. After reviewing the 2014 actual results, management made plans for 2015 that would come in just at the 440% RBC target. That review of the 2014 actual included consideration of the increase in profits associated with the additional risk. When management made the adjustment to reach target for 2015, its first consideration was to reduce less profitable activities. Management was able to make adjustments that significantly improve return for risk taking at a fully utilized level of operation.