Usually, the first questions the project director asks are,
- “What are the top 10 risks by cost P80?”
- “What is the P80 of cost risk?”
- “How does the total compare with the cost contingency?”
These seem like fundamental, simple questions for a project director, but they actually display a complete failure to understand the nature of risk or risk over time.
In this short paper, I want to summarize just what information monthly risk reports can provide that is useful to the project managers.
1. Quantitative Risk Analysis
Monte Carlo simulation is the core of quantitative risk analysis (QRA) and is used to combine risk distribution assessments for probability and consequence.
Risk is historically defined as the product of probability and consequence (De Moivre 1711). But multiplying two distributions together is no casual mathematical exercise. On a mega-project, there can easily be a thousand-plus risks. The sum of all the products of the individual risks is a distribution for the total risk.
Risk has two components:
i. Probability of occurrence, the subjective belief that it will occur. This is a binary distribution because it has two states -- i.e., it happens or doesn't happen -- and is called a Bernoulli distribution
ii. A consequence measured in terms of cost, delay or performance deterioration. This is also a distribution. In project risk, three-point triangular or PERT distributions are commonly used.
With the understanding that risk is composed of two probability distributions, one can see that describing risk magnitude in the "project management way," by a single value (the P80 of cost) doesn't make any sense at all.
The usual way to show a risk distribution for either an individual risk or for total risk is with a Pareto graph, which combines a probability density function (pdf) and a cumulative density function (cdf). These are also known as a histogram with an S-curve.
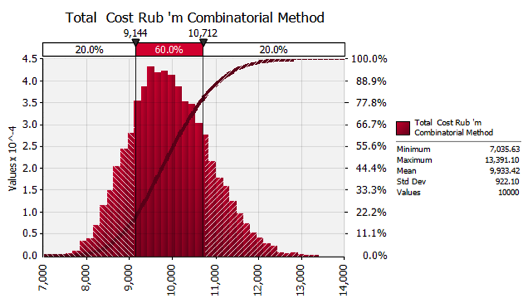 Figure 1. A Pareto Graph
2. What are the Top 10 Risks?
It is common for the project director to request the top 10 risks in monthly risk reports for both cost risk and schedule (delay) risk. These are usually ranked in descending of P80.
What is P80? This means the 80 percentile of the distribution -- 80% of the data points are to the left of the 80
th percentile and 20% to the right.
The interpretation of this is that one can be 80% sure that the cost or delay will be at that value or less and, conversely, that one can be 20% sure that the cost/delay will be greater.
Some companies use the P90, which suggest they are more risk averse. Some use P75, which is the upper quartile, Some use P68.2, which is one standard deviation – the statistical metric for uncertainty. And some companies use the P50, which is the same as tossing a coin.
It is not possible to use Pareto graphs to identify the top risks. This is best done using either or all of the following graph types:
- Box and whisker graph
- Tornado diagram
- Density strip
All of these three methods work well in visually presenting the risks in order of magnitude, although the tornado chart is rather a "black box" method that may give different results from the other two graphs.
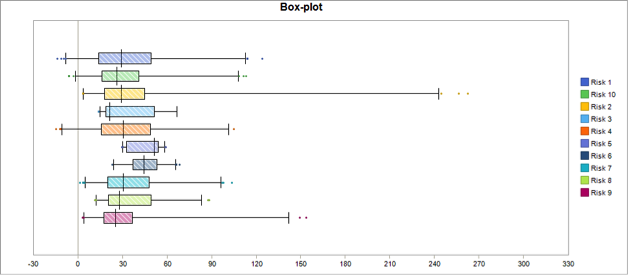 Figure 2 Box & Whisker Graph
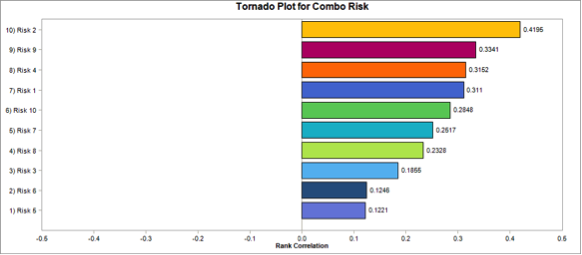 Figure 3 Tornado Diagram
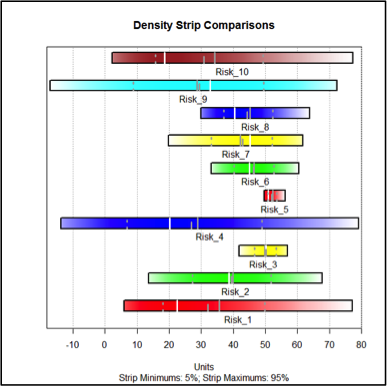 Figure 4 Impact Density Strips
It is important to understand that the P80 value does not tell one which is the biggest risk; the P80 is a single point on the pdf that simply means that one can be 80% sure that it will cost $X or less or that you can be 20% sure that it will cost $X or more!
Do you get the message there about uncertainty?
To truly explain this important point, I have plotted 10 risks, all with approximately the same P80 = 54.2, in the iso-contour graph below. Each of the risks has a different consequence and different probability.
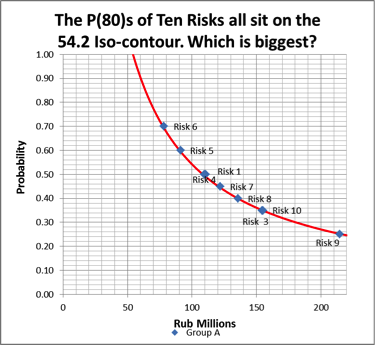
Figure 5 Iso-Contour Chart of 10 Risks With P80=54.2
Using the box & whisker plot and impact density strip, it should be immediately apparent, even to the untrained eye, that the risks are very different in terms of uncertainty and consequence. The challenge is determine which is biggest.
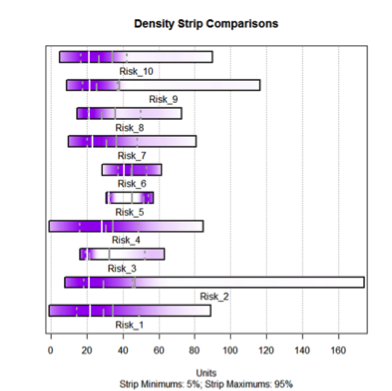 Figure 6 Density Strip of the 10 Risks
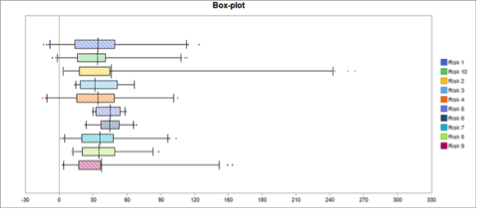
Figure 7 Box & Whisker Plot of the 10 Risks
We can see that risk 5 is actually quite certain, whereas risk 2 is very uncertain, and yet they both have the same P80. Here we need to understand how to deal with a risk and its certainty.
It should now be clear that ranking and prioritizing risks on the basis of P80 alone is neither correct nor particularly meaningful, as all evidence of the probability distribution and impact distribution are missing. The three graphical solutions – box plot, density strip and tornado diagram -- make it easier for the managers to prioritize the risks visually by relating directly to both consequence and uncertainty.
3. What Is the Significance of the Total P80 Cost?
Almost the very first number that appears in the monthly risk report will be the P80 total for all cost risks. You might wonder why the P80 instead of the P90 or P50 or the standard deviation (P68.2).
To project directors, the P80 is a magic number that can be shared with colleagues, the directors, the client. Why the P80 became the popular percentile is unknown. There is obviously a relationship between risk aversion and risk taking -- the more risk averse, the higher the P value that is preferred.
-- Contingency as a percentage of baseline cost
The project planning process will involve detailed cost estimates by quantity surveyors and cost engineers. These estimates will become the baseline cost of the project covering materials, labor and inflation. The risk manager will endeavor to get the cost team to do a risk review and build a range of uncertainties around the costs. During the design stage, this will usually be a +/-25% ball park figure, with the range narrowing as design and time progress.
The formula used for determining cost based contingency is usually:
P80 of cost estimate – base cost = contingency
Often, the cost team includes project risks in the calculations, which are based on their personal experiences, which are usually undocumented and which inflate the base cost. You do not want this to happen.
The planning team will, at the outset, establish some percentage of the total cost as a contingency. On the most recent mega-project valued at $2.3 billion, the contingency was 7% of the total forecast cost. How this contingency was determined was undocumented but presumably based on some experiential rule of thumb of the planning team. Curiously, this figure was shown on the management reports as a P80, presumably in an endeavor to give credibility to the contingency figure.
-- Contingency as a function of risk assessment
The risk management process is a journey over the duration of the project. It starts at the design phase, progresses through manufacturing, then on to construction and finally to commissioning. Although these are broadly distinct phases, there will be many overlapping time periods.
The time of greatest risk will be during the design phase, when everything is pretty much unknown to all the project team. The uncertainties will be legion, from planning permission to technology, contracts to quality control, civil engineering works to change management.
The risk should appear as a series of waves, growing rapidly during the design phase and then decreasing until approaching zero as the problems are solved. After all, you wouldn’t begin a project with huge quantities of unresolved risk.
The graph below gives a idea of the risk over time over the course of the project:
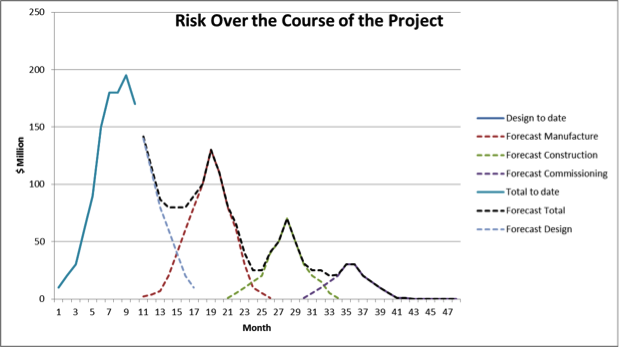 Figure 8 Risk Over Time
As each phase progresses, the risk will ebb and flow, progressively decreasing as the project concludes successfully.
The risk total for the month will have meaning only in the context of the previous month’s risk total, the phase of the project and the forecast for the future risk over the course of the project.
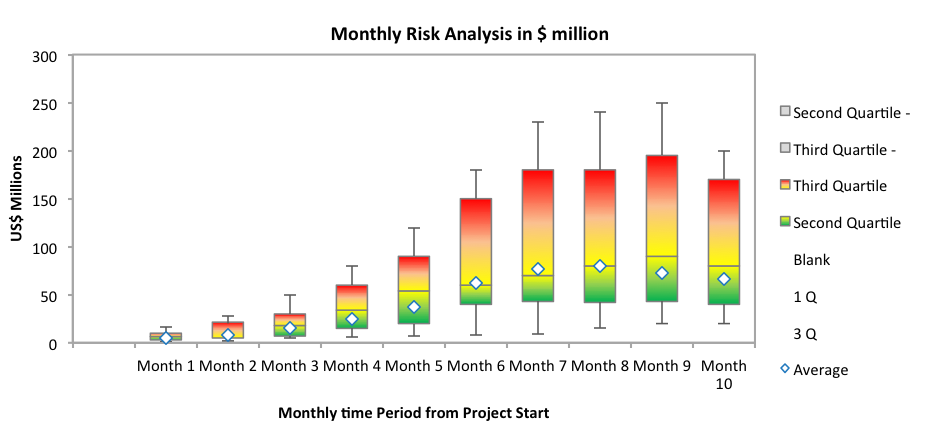
Figure 9 A Box & Whisker Plot of the First 10 Monthly Total Risk Values
It can be seen from Figure 9 that the risk is progressively increasing until month 9, after which it appears to start declining. Risk will follow the phases described in Figure 8. Risk can be graphed according to each individual phase or a global overview.
It should be apparent that the P80 doesn’t help the project director understand the current or future risk on the project, the nature of the uncertainty or the risk over time.
A simple enhancement in Excel combining Figures 8 and 9 is given in Figure 10 so that deviations from forecast are clearly visible and comparable.
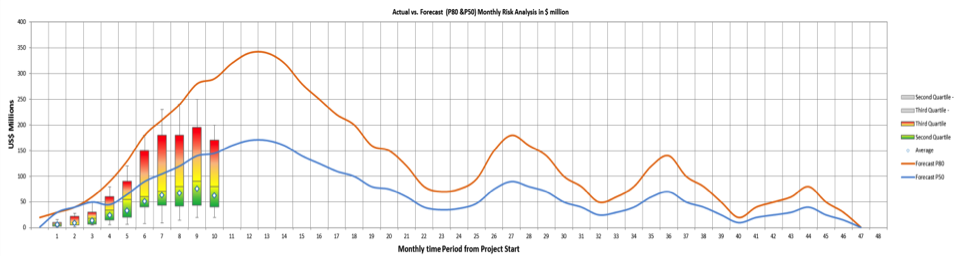
Figure 10 Current Monthly Risk Total Vs. Forecast P50 & P90.
The range of uncertainty in the current situation and the forecast are clearly displayed. Alternative measures of uncertainty can be used -- e.g., mean+/- 1 standard deviation.
In Figure 10, there is a noticeable discrepancy between the current total risk and the forecast. It is essential to understand and report on the source -- for example, possibilities such as these:
- Fewer risks have been identified than expected
- The quantification of risks is too optimistic, i.e., lower cost
- The handling plans are assessed as more effective
- The forecast risk is higher than actually being experienced during design stage
- The design phase is running behind schedule
- Improved estimation skills are required, so a calibration training course needs to be put in place
It is important for the project director to understand exactly what is being measured in this concept of total risk.
Useful reference:
How to Manage Project Opportunity and Risk: Why Uncertainty Management Can be a Much Better Approach Than Risk Management, by Stephen Ward and Chris Chapman.