
In their search to boost profits and reduce their loss ratio, property and casualty (P&C) insurance carriers often turn to improving a cast of “usual suspects”: sales, pricing, new product development and a host of operational areas from new business through subrogation. But the biggest area to target— the one with the largest, near-term upside potential—is claims processing. Every insurer wants to reduce operating costs, cut claims leakage and reduce claim severity.
But what’s the best approach?
That depends on whom you ask. Technology providers insist that bleeding-edge, massive new systems are the answer. Internal processing teams will push for more human resources—with more relevant experience and better training. Other executivess will tell you to focus on reducing claims fraud.
But if you ask The Lab, we will say that the best approach is to keep asking questions, because the answers will point you toward a massive payback—a windfall. For example, what is the “standard” P&C claims leakage ratio, i.e., the industry average benchmark? And what is the source for this leakage number? Probably, the answer you get on leakage ratio will fall in the 2% to 4% range. Press for the source. The likely answer will be vague and hard to pin down. It’s unlikely that the answer will be: “our routine analysis and measurement of our claims processing operations—at the individual adjuster level.”
Stated differently, the source is actually “conventional industry wisdom.” If so, you’ve stumbled into a diamond field of improvement opportunities. To scoop them up, all you need to do is upgrade your company’s ability to perceive and manage claims processing at an unprecedented level of granular detail.
It’s worth the heavy investment of initially tedious effort. That’s because actual claims leakage is typically several multiples of this conventional-wisdom average of 2% to 4%: The Lab routinely documents 20% to 30%, and even more. That means that the payoff for reducing leakage, even for smaller P&C insurers, can easily reach hundreds of millions of dollars—which drop straight to the bottom line.
No, customer experience isn’t devastated. That’s because other (completely satisfied) policyholders are having their claims paid by adjusters who follow the carrier’s guidelines. The lower-performing adjusters, on the other hand, are simply not following these guidelines, and carriers fail to practice the process-management discipline necessary to ensure that all adjusters adhere to the loss-payment rules and targets.
Now, if you ask The Lab precisely how to reduce your claims leakage and loss ratio, we will point to three underused tools, or improvement approaches, to help P&C insurers surmount this challenge and achieve breakthrough levels of benefits, specifically:
- Knowledge work standardization (KWS)
- Business intelligence (BI)
- Robotic process automation (RPA)
While the second two—BI and RPA—require a nominal amount of technology, the first approach, standardization, not only paves the way for the other two but also requires no new technology whatsoever. Typically, Knowledge Work Standardization, or KWS, alone delivers labor savings in excess of 20%, easily self-funding its own implementation— and readily covering much of the BI and RPA improvement costs. Taken together, these three tools rapidly transform an insurer’s P&C claims-processing operation and upgrade its related management capability. This allows management to significantly reduce loss payments while simultaneously improving operating efficiency. The result is an increase in “operating leverage”: the capability of a business to grow revenue faster than costs.
Interestingly, these three tools, or improvement approaches, also deliver major benefits for customer experience, or CX, aiding in policyholder satisfaction and retention. Here’s how:
- First, roughly half of the hundreds of operational improvements identified during business process documentation will also deliver a direct benefit to policyholders.
- Second, the process documentation and data analysis help pinpoint the reasons that policyholders leave. The predictive models that result help reduce customer erosion.
- Third, these documentation and analytical tasks also identify the most advantageous opportunities for cross-selling and upselling. In this article, we will cover these three tools/improvement approaches broadly, then we’ll drill down to explore their real- world application—and benefits—in P&C claims processing.
1: The Search for Standardization in P&C Insurance Operations
Standardization—the same innovation that gave rise to the modern factory system—is arguably the most overlooked improvement tool in insurance operations today. And it applies to everything: data, processes, work activities, instructions, you name it. In other words, variance is standardization’s costly, inefficient evil twin. Consider:
- Insurance operations performance is typically reported
in the form of averages. These numbers are usually calculated for work teams or organizations. And this is also how supervisors approach their management task—by groups. Individuals’ performance is rarely measured, compared, benchmarked or managed. - Rules of thumb routinely apply. “Here’s how many claims an adjuster should be able to process in a given day or month.”
- Industry lore trumps data-driven decision-making: “Claims processing is an art, not a science.” Or, even more dangerously: “Faster adjusters are the costliest ones, because they’ll always pay out too much.” (Spoiler alert: The opposite is true.)
- Differences in details go unexploited: At one insurer, for example, The Lab discovered that five teams were processing claims—and each team used its own format and guidelines for notes. That single, simple issue confounded everyone downstream, as they struggled to reconcile who meant what.
- “NIGO” prevails. The sheer opportunity cost of things like forms and fields submitted “not in good order,” or NIGO, can be staggering—often with tens of millions of dollars in unrecouped revenue flying just below executives’ radar.
2: Applying Business Intelligence, or BI, to Insurance Operations
Modern BI applications derive their power from their ability to create a clear picture from crushingly vast quantities of seemingly incompatible data. The best BI dashboards visualize this data as insightful, inarguable business-decision information, updated in real time. They let users zoom out or drill down easily; just think of Google maps. You can click from a state, to a city, to a house, then back up to a continent, using either a graphical map format or 3-D satellite photo.
Then why aren’t insurers routinely harnessing this power? Most already own one or more BI applications, yet they’re not delivering that critical Google-maps-style visualization and navigation capability.
This lack can be traced to two, intertwined obstacles: business data and business processes. Each requires its own, tediously mundane, routinely overlooked and massively valuable, non-technology solution: standardization.
See also: Provocative View on Future of P&C Claims
Business data is already well defined—but it’s defined almost exclusively in IT terms. Think of the latitude/longitude coordinates on Google maps; do you ever actually use those? These existing IT definitions are difficult, if not impossible, to reliably link to business operations and thus produce useful, navigable business information.
The Lab solves this problem by mapping existing “core systems” data points to products, employees, transactions, cycle times, organizational groups and more. The solution requires standardizing the company organization chart, product names, error definitions and similar non-technology items. This is a tediously mundane task.
Technology can’t do this. But people can, in a few weeks if they have the right templates and experience.
Business processes are also already defined—but with wildly inconsistent scope. For example, the IT definition typically involves a “nano-scale” process—like a currency conversion or invoice reconciliation. Business definitions represent the polar opposite: global scale. Think of “order-to-cash” or “procure-to-pay.” All parties involved—throughout business and IT—thus talk past each other, assuming that everyone is on the same page. Worst of all, almost no business processes are documented. They exist informally as “tribal knowledge.”
The Lab solves this disconnect by mapping business processes, end-to-end at the same “activity” level of detail that manufacturers have perfected over the past century. Each activity is about two minutes in average duration. The range for all activities is wide but easily manageable: from a few seconds to five minutes. Over the past 25 years, The Lab has process-mapped every aspect of P&C insurance operations—and we’ve kept templates of every detail for these highly similar processes. Consequently, we can (and routinely do) map business processes remotely, via web conference... around the world!
Rigorously defining, standardizing, and linking business data and business processes underpins the best BI dashboards, delivering the Google-maps-style navigation that execs crave. This is how it's possible to build astonishingly insightful BI dashboards that help make claims leakage losses apparent to our clients.
3: Robotic Process Automation, or RPA: A Powerful New Tool for P&C Carriers

Robotic process automation, or RPA, is simply software— offered by companies such as Automation Anywhere, Blue Prism, and UiPath—which can “sit at a computer” and mimic the actions of a human worker, such as clicking on windows, selecting text or data, copying and pasting and switching between applications. If you’ve ever seen an Excel macro at work, then you can appreciate RPA; it simply handles more chores and more systems. And it isn’t limited to a single application, like Excel. It is as free to navigate the IT ecosystem as any employee.
RPA “robots” are thus ideally suited for mundane yet important repetitious tasks that highly paid P&C knowledge workers hate to do. Better yet, robots work far faster than people, without getting tired, taking breaks or making mistakes. This frees up human workers for higher-value activities.
RPA also confers customer experience, or CX, benefits. With faster operations, customers enjoy the Amazon-style responsiveness they’ve come to expect from all businesses. On-hold times are reduced, claims get processed faster and the entire company appears more responsive.
Beyond the dual opportunities of knowledge-worker labor savings and CX lift, RPA holds the power to disrupt entire industries. Deployed creatively in massive waves, it can deliver windfall profits on a scale not even imagined by its purveyors.
Yet, today, most insurance companies’ RPA efforts, if any, are stalled at the very beginning; recent surveys indicate that internal teams hit a 10-bot barrier and struggle to find more opportunities, or “use cases.” That’s because the underlying processes to be automated are never made “robot-friendly” in the first place. So there needs to be scrutiny of the different activities—and the elimination of all of the wasteful ones that hide in plain sight, such as rework, return of NIGO input, and so on.
How to Overcome the 10-Bot Barrier in P&C Claims Processing
First, set expectations to focus on incremental automation with bots. No, you’re not going to replace an entire adjuster with a bot. But, yes, you will be able to quickly use a bot to call a manager’s attention to a high-payback intervention in the P&C claims-adjusting process. Examples:
- Managers look for inactivity on open claims: If a claim is open with no activity in the last 10 days, that’s a red flag. But many claims are overlooked. A bot can call these out promptly.
- Full-replacement cost, instead of partial replacement cost, is a major cause of overpayment that is most prevalent in roofing, flooring and cabinetry replacements. Bots can track payments and send management alerts based on line-of-coverage and even more granular detail. Roofing examples include: replacement, whole slope vs. whole roof; and number of roof squares replaced.
- Audits are conducted on claims to improve quality and consistency—and to reduce overpayment. However, these are done on a very limited sample and only after claims have been paid and closed. Based on learnings from past audits, bots can alert management when certain claims- processing failures happen on a live basis. Managers can intervene... before payment.
Standardization (KWS), BI, & RPA: Focusing on P&C Claims Processing
All three of the above tools, or improvement approaches for P&C carriers—standardization or KWS; business intelligence, or BI; and robotic process automation, or RPA—can be readily applied to claims operations. Indeed, they seem to be custom- made for it.
Standardization
Consider the following story, created from a mashup of different P&C insurance carrier clients of The Lab:
This “insurer” had plenty of claims data to share with The Lab; in fact, theirs was better than most. But that’s not saying too much: While 40% of the data was usable and comprehensible, the other 60% wasn’t. (Remember: This is better than most P&C insurers.)
Data was reported weekly, and sometimes daily, on an organization-wide basis. Here’s what they had data to report on:
- Overall averages of claims processed, based on total headcount.
- Average losses paid per claim.
That said, the company never tracked the performance of individual claims processors. They were all effectively “self- managed,” following their own individual procedures. There were no standard, activity-level instructions and guidelines, set by management, for quantifying targets for time, productivity or effectiveness. There were, on the other hand, vague, directional methods, many in the form of undocumented “tribal knowledge” and “rules of thumb.” The claims processors simply managed their own workdays, tasks and goals—similar to Victorian-era artisans, prior to the advent of the factory system.
When pressed, the company defended its choice to not track individual performance. The two reasons it gave would come back to bite the managers:
- They were confident that individual performance, if measured, would only vary by about 5% to 10%, maybe 15% at most.
- They were equally confident that imposing time and productivity quotas on processors would increase loss severity. In other words, they were completely sure that faster claims processing equates to overpayment of claims.
However, their very own data contradicted both of these notions—in a huge way:
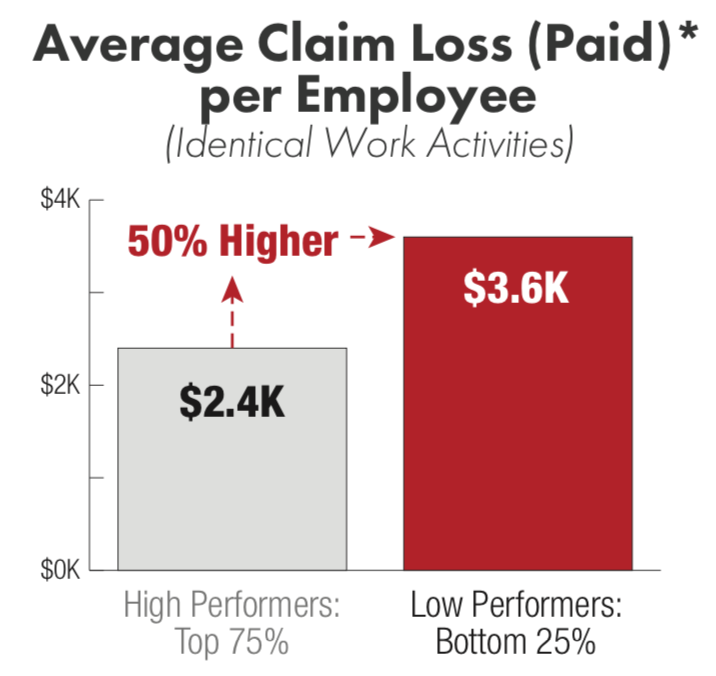
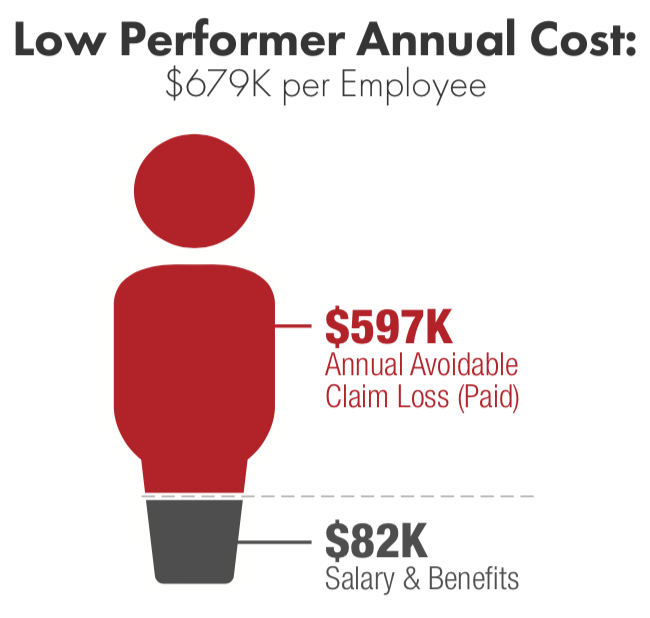
- First, the “long tail” of claims processors revealed a 250% variance between the top and bottom quartiles of individual performers—that’s 15 to 50 times higher than what management believed to be the case. In other words, the top three quartiles were out-processing the bottom quartile so much that there was no hope of the bottom quartile catching up—even getting close to the average. Put another way: Reducing this variance alone would yield a 25% capacity gain—an operating expense savings. And it could be accomplished by the top performers’ simply processing just one more claim per day—an increase they’d barely even notice.
- Second—and just as important—the data revealed that the slower performers actually overpaid each claim by an average of 50%, an amount that totaled in the scores of millions, swamping the amount spent to pay their salaries. This carrier was thus getting the worst of both worlds with its lowest performers: They were slower, and vastly more costly. Not only that, they dragged down the average performance figures (not to mention morale) of the faster, leaner producers.
The impact from these revelations equated to losses measured in hundreds of millions of dollars. Incidentally, the story above is not rare; rather, it’s typical. As we’d mentioned, it’s based on a mashup of several insurance carriers.
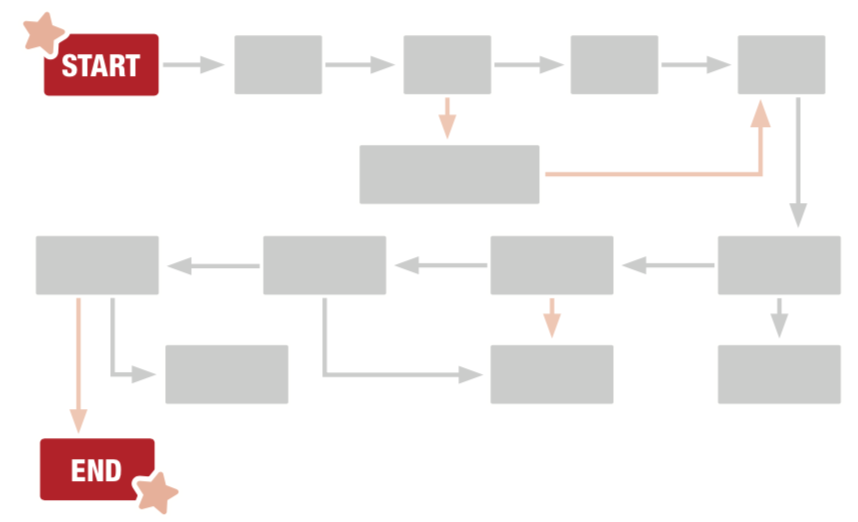
Here’s one other standardization eye-opener. The claims process itself was rife with rework, turnaround, pushback and error correction. As a claim made its way through reporting, contact, dispatch, estimating, investigation and finally payment, it bounced and backtracked between the FNOL (first notice of loss) team, the appraiser, the casualty adjuster and so on. When presented with this “subway map” of the as-is process, the insurer’s executive sponsors were aghast:
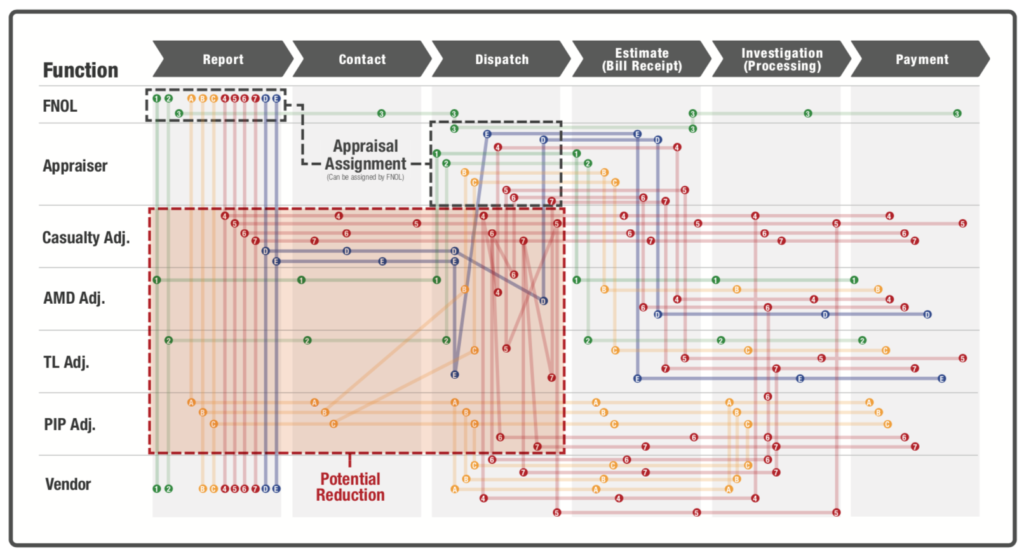
Fortunately, the “spaghetti mess” can be cleaned up, even without new technology.
Business Intelligence (BI)
The Lab often encounters P&C insurance companies that invest heavily in systems such as Oracle Business Intelligence or Microsoft Power BI yet struggle to get value from these advanced analytics platforms.
Many of the issues stem from failing to “complete the final mile” when it comes to data definitions and hierarchies; that is, companies aren't reconciling the IT-defined data elements with their own business-defined operations characteristics. This problem can often be traced to a disconnect between business leaders and IT organizations.
An IT person could—and often does—assemble and manage business intelligence for business units. But the person needs to understand the business so well that the person could confidently select which data to use and aggregate so that the final KPI (key performance indicator) in the resulting dashboard represents reality. And even if the person managed to create a BI picture of perfect “reality,” there’s no guarantee that the business would accept it. Let’s be frank: Creating useful BI and related analytics is a towering challenge. It’s overwhelming not only to IT; most businesspeople lack both the documentation and the comprehensive perspective to pull it off. So, the status quo continues: The “business language” experts will talk with the “IT language” experts, and the business executives will still lack the Google-maps insights they seek.
See also: Keeping Businesses Going in a Crisis
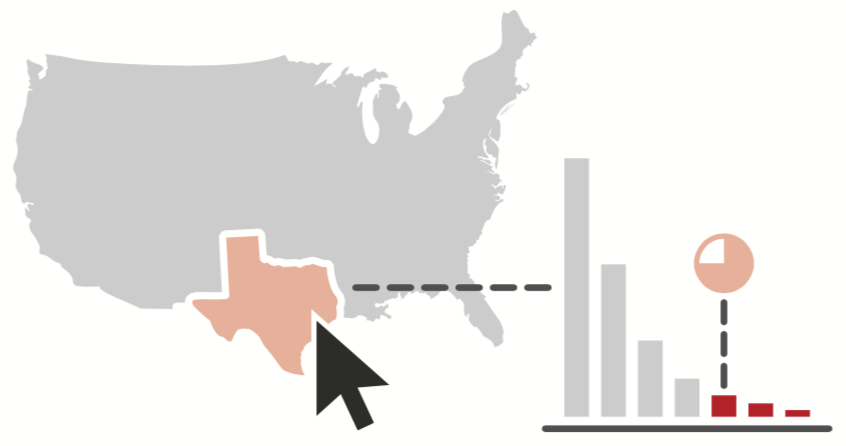
Another BI stumbling block is the “false precision” of too much data and too many categories. Consider the automotive insurer with “claims types gone wild”—such as “Accident: Right front fender,” and “Accident: Left front fender,” and so on. The Lab’s BI dashboards will often reveal to claims executives that 20% of the claims types represent 80% of the volume—another valuable, “long-tail” insight.
Robotic Process Automation (RBA)
As noted earlier, operational issues and customer-experience or CX challenges are typically two sides of the same coin. Often, both can be addressed by robots.
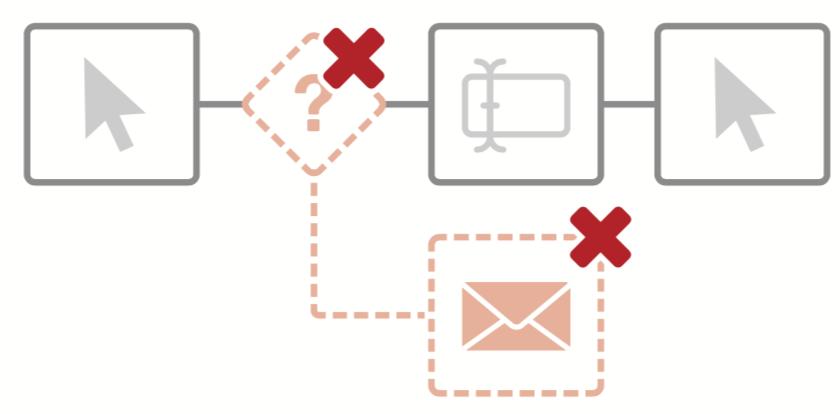
For example, consider the policyholder who calls the FNOL contact center and validates info. Then the person is handed off to another rep, who must re-validate the info. And then another. And another.
That’s not just an operational mess. It’s also creates a clear and present danger of losing that customer, hiding in plain sight.
While robots can speed repetitive chores, they can’t fix the underlying business processes (remember that FNOL spaghetti map, above?). Fortunately, Knowledge Work Standardization can. And once it does, the robotic possibilities are practically limitless: They span everything from sales prospecting to renewal notices to premiums/commissions reconciliation.
You saw how RPA bot deployments augmented the work of claims-processing managers. The next step is to augment the hands-on work of rank-and-file adjusters. Again, don’t try to replace the entire job position. Instead, augment the processor’s activities. In particular, hand off the adjuster’s mind-numbingly repetitive activities to the bot. This will allow the adjuster more time and thought—not to mention accountability—for complying with the policy’s payment guidelines.
For P&C claims, there are numerous opportunities to “park a bot” on top of routine, repetitive, knowledge-worker activity. Think of these as admin-assistant bots for adjusters. Here are two of many examples:
- The “pre-adjudication assistant” bot. Adjusters spend lots of time sorting out “unstructured” information at the receipt of the FNOL. For example, they read descriptions of damage that arrive in free text data fields, then they standardize it and proceed to adjudication activities such as looking up coverages and setting reserves for the claim, prior to contacting the insured. Most, if not all, of these activities can be performed by RPA bots—but only if the inbound information is standardized. The Lab has used its KWS methods to create drop-down menus for this data and make it RPA-friendly. This standardization can be done incrementally, enabling bots to prep claims for adjusters: They look up coverage limits, set reserves and prep for the adjuster’s call to the insured.
- The “customer contact assistant” bot. Adjusters, and others in the contact center, spend a great deal of avoidable and inefficient effort communicating with policyholders regarding their claims: advising status, notifying for damage inspections, obtaining corrections to initial NIGO information and more. Simply contacting customers can be a tedious, time-consuming and inefficient process; bots can help. They can be configured to send notifications to customers, preempting calls to the contact center. Bots can also initiate “text-call-text” notifications to customers’ cell phones. Here’s how it works: Bots, at the push of a button by the adjuster, send a text to the customer. The text may notify the customer to expect a call from the adjuster—avoiding call screening. The adjuster calls and gets through. Afterward, the bot sends a confirmation of the issue or next step.
Make the Move Toward Improved Insurance Operations & Reduced Loss Ratio
Claims processing, as we’d mentioned at the outset, is just one area within the P&C carrier organization where the power triumvirate of Knowledge Work Standardization (KWS), business intelligence (BI) and robotic process automation (RPA) rapidly deliver massive windfall value.