The diabetes industry is far more sophisticated than the wellness industry when it comes to dramatically overstating outcomes and savings. Excluding vendors by the Validation Institute like It Starts with Me and US Preventive Medicine, wellness industry claims can easily be shown to be fraudulent. It’s equally easy to back that assertion with a $3 million reward, knowing that no wellness vendor or consultant or “guru” will ever try to claim it, even though I’ve made it ridiculously easy, accepting the burden of proof and only allowing myself to pick one of the five judges.
By contrast, unlike the more transparently dishonest wellness industry, the diabetes industry’s “outcomes” can only be challenged, rather than simply invalidated on their face. And no way I’m offering a reward. (I’ll make an even-money bet, though – same rules.) There could be actual savings from these programs, but these five examples of biostatistical sleight-of-hand suggest that those actual savings, if any, are far more modest than claimed savings.
1. Conflating verb tenses
Here is a claim by a diabetes prevention vendor showing ROI on its program. One would be excused for thinking that these results had actually been achieved and validated, given the choice of verb tense in the graphic:
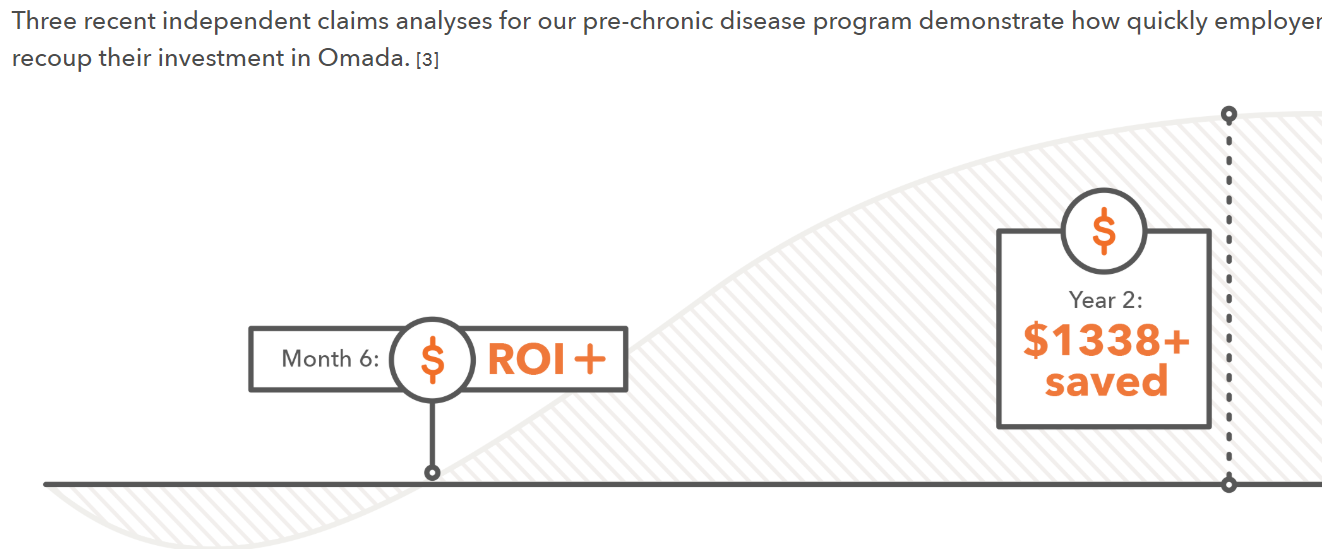 Looking harder at the language, note that the phrase is “recoup their investment,” not “were validated by the Validation Institute as having recouped their investment.” Yet the verb “saved” is in the past tense.
And the heading says: “How quickly employers recoup,” whereas the only article cited in the footnote analyzed Medicare patients, whose chronic disease are far more advanced.
Further, digging into the actual article (financed by the vendor) yields the following sentence [emphasis mine]:
We used a Markov-based microsimulation model in which a person’s characteristics are used to predict health outcomes in the upcoming year.
Elsewhere the article says:
We applied 26-week weight loss results to simulate potential health and economic outcomes
Therefore, this entire claim is based on a predictive simulation model that somehow morphs into a clear statement showing precisely $1,338 “saved."
Speeding up time
As can be seen from that graphic, this particular vendor is claiming a huge ROI in two years for employees with pre-diabetes. However, the Centers for Disease Control and Prevention says:
One in 3 adults in the United States has pre-diabetes (fasting blood glucose, 100–125 mg/dL); 15% to 30% of those adults will develop type 2 diabetes mellitus within 5 years.
See also: Diabetes: Defining Moment of a Crisis
So only a small minority of pre-diabetics will develop diabetes in five years. And then, of course, it would take years for avoidable complications to develop even if no one “manages” the newly diabetic employees to avoid them.
How, then can $1,338 of expenses per participant be claimed to be avoided by keeping these employees from getting sick in a measly two years when most of these employees aren’t going to be sick five years from now even without an intervention?
Comparing participants to non-participants
Speaking of “participants”…
Let’s be very clear: Whenever you see the word “participants” in a study report, the claimed outcome is vastly overstated. Participants will always outperform non-participants, regardless of the intervention. The National Bureau of Economic Research proved this using a randomized control trial. Further, on three other occasions, biased researchers trying hard to prove the opposite accidentally showed that 100% of their apparent “savings” were attributable to participation bias, meaning 0% to the program. (The bias won’t always account for 100% of the claimed savings, of course.)
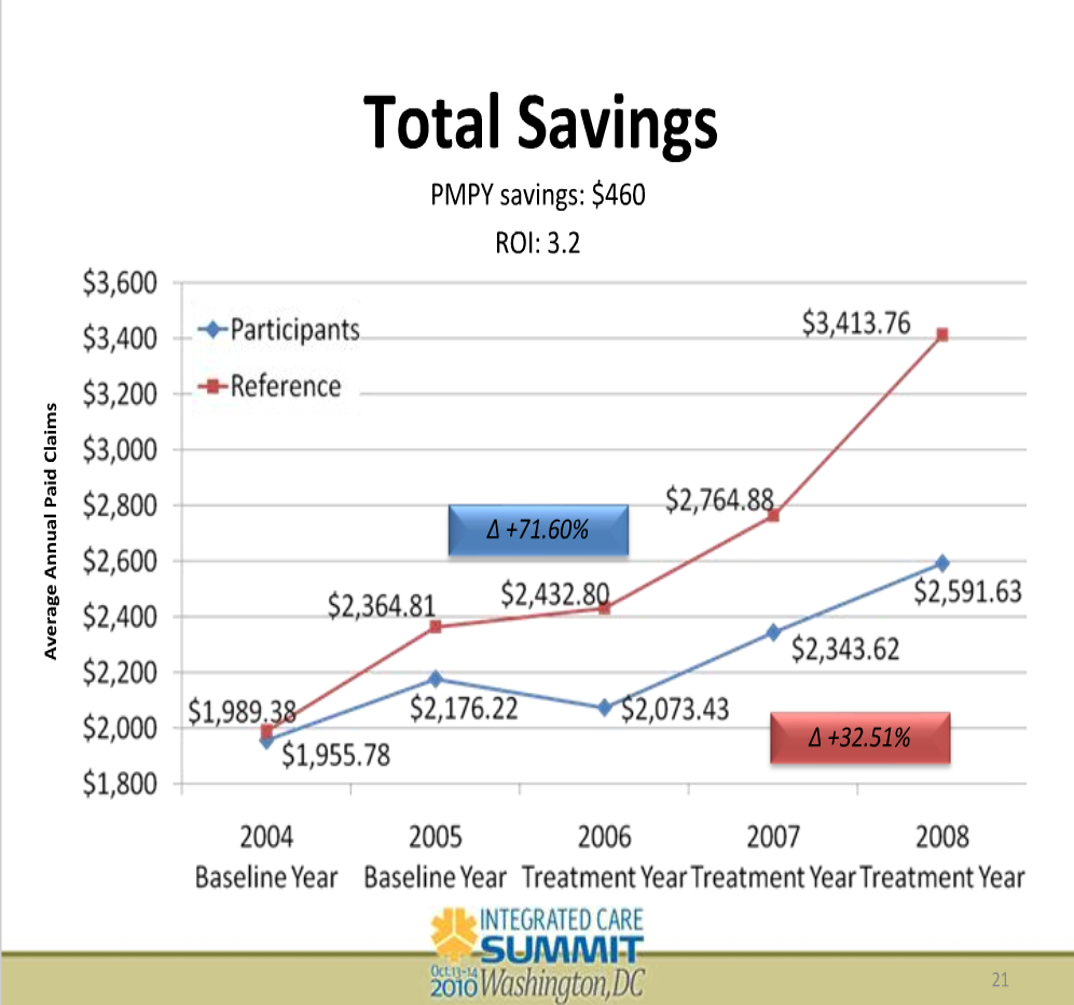
The best example of this bias? A Koop Award-winning wellness program accidentally revealed that participants hugely outperformed non-participants even when there was not a program to participate in. In this slide, note the X-axis. The groups were separated in 2004. The program was implemented in 2006. During the two years between separation and implementation, the participants “saved” almost 20% vs. the non-participants by doing nothing.
Looking harder at the language, note that the phrase is “recoup their investment,” not “were validated by the Validation Institute as having recouped their investment.” Yet the verb “saved” is in the past tense.
And the heading says: “How quickly employers recoup,” whereas the only article cited in the footnote analyzed Medicare patients, whose chronic disease are far more advanced.
Further, digging into the actual article (financed by the vendor) yields the following sentence [emphasis mine]:
We used a Markov-based microsimulation model in which a person’s characteristics are used to predict health outcomes in the upcoming year.
Elsewhere the article says:
We applied 26-week weight loss results to simulate potential health and economic outcomes
Therefore, this entire claim is based on a predictive simulation model that somehow morphs into a clear statement showing precisely $1,338 “saved."
Speeding up time
As can be seen from that graphic, this particular vendor is claiming a huge ROI in two years for employees with pre-diabetes. However, the Centers for Disease Control and Prevention says:
One in 3 adults in the United States has pre-diabetes (fasting blood glucose, 100–125 mg/dL); 15% to 30% of those adults will develop type 2 diabetes mellitus within 5 years.
See also: Diabetes: Defining Moment of a Crisis
So only a small minority of pre-diabetics will develop diabetes in five years. And then, of course, it would take years for avoidable complications to develop even if no one “manages” the newly diabetic employees to avoid them.
How, then can $1,338 of expenses per participant be claimed to be avoided by keeping these employees from getting sick in a measly two years when most of these employees aren’t going to be sick five years from now even without an intervention?
Comparing participants to non-participants
Speaking of “participants”…
Let’s be very clear: Whenever you see the word “participants” in a study report, the claimed outcome is vastly overstated. Participants will always outperform non-participants, regardless of the intervention. The National Bureau of Economic Research proved this using a randomized control trial. Further, on three other occasions, biased researchers trying hard to prove the opposite accidentally showed that 100% of their apparent “savings” were attributable to participation bias, meaning 0% to the program. (The bias won’t always account for 100% of the claimed savings, of course.)
The best example of this bias? A Koop Award-winning wellness program accidentally revealed that participants hugely outperformed non-participants even when there was not a program to participate in. In this slide, note the X-axis. The groups were separated in 2004. The program was implemented in 2006. During the two years between separation and implementation, the participants “saved” almost 20% vs. the non-participants by doing nothing.
 This isn’t a secret. Participation bias is well-known to insiders in the diabetes industry. Yet every single diabetes vendor ignores this bias (or “matches” participants to some medical charts), while most also fail to disclose the dropout rate – and the fact that most employees who drop out of programs do so because they aren’t getting results.
Projecting participants’(!) short-term weight loss into the future
Essentially all of them do this, too. Very large-scale studies have shown that only the smallest percentage of people who lose weight keep it off. There is no reason to think that somehow a few diabetes vendors have unlocked the key to long-term weight loss that has eluded the rest of the world and all academic researchers, especially when the vendors don’t follow employees for the long term or count dropouts.
Rhetorical and arithmetical sleight-of-hand
This single set of claims from a diabetes vendor looks quite impressive at first glance:
This isn’t a secret. Participation bias is well-known to insiders in the diabetes industry. Yet every single diabetes vendor ignores this bias (or “matches” participants to some medical charts), while most also fail to disclose the dropout rate – and the fact that most employees who drop out of programs do so because they aren’t getting results.
Projecting participants’(!) short-term weight loss into the future
Essentially all of them do this, too. Very large-scale studies have shown that only the smallest percentage of people who lose weight keep it off. There is no reason to think that somehow a few diabetes vendors have unlocked the key to long-term weight loss that has eluded the rest of the world and all academic researchers, especially when the vendors don’t follow employees for the long term or count dropouts.
Rhetorical and arithmetical sleight-of-hand
This single set of claims from a diabetes vendor looks quite impressive at first glance:
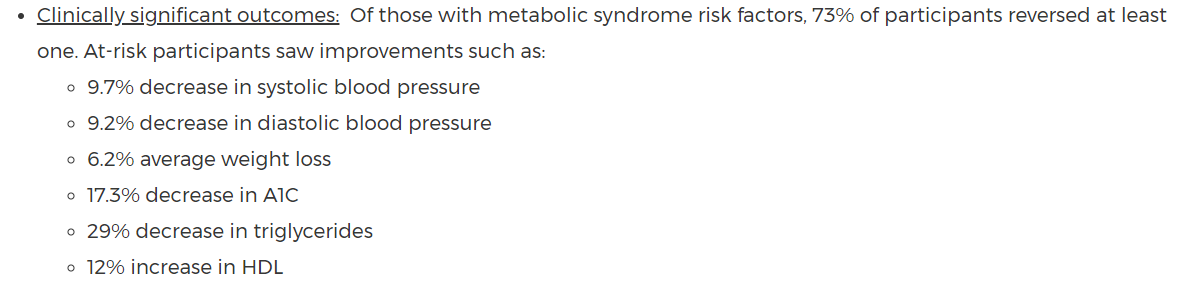 Now look at it again, paying special attention to the underlined words:
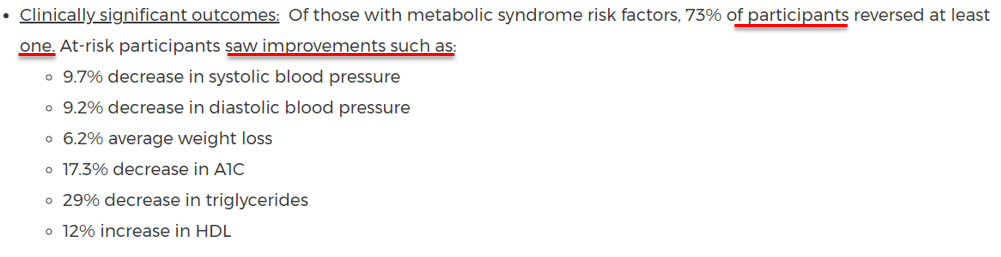 Once again, there is that word “participants.” That is just the tip of the invalidity iceberg. Six variables were tracked…and yet 27% of active, motivated participants weren’t able to reduce any. Randomly, three should decline. And many of the other 73% of participants could reduce only one…and this is considered successful?
Further, these statistics look like averages on first glance –but they are not. They are examples (“improvements such as”) of reductions that maybe a few participants achieved. I can guarantee that, absent statins, virtually nobody reduces triglycerides by 29%.
Regression to the mean
Diabetes vendors often split the population into high and low utilizers and claim credit for reductions in high utilizers (whom they manage) while counting the utilization increase in low utilizers toward their “savings” — as though last year’s high utilizers also would have increased had it not been for the program.
Once again, there is that word “participants.” That is just the tip of the invalidity iceberg. Six variables were tracked…and yet 27% of active, motivated participants weren’t able to reduce any. Randomly, three should decline. And many of the other 73% of participants could reduce only one…and this is considered successful?
Further, these statistics look like averages on first glance –but they are not. They are examples (“improvements such as”) of reductions that maybe a few participants achieved. I can guarantee that, absent statins, virtually nobody reduces triglycerides by 29%.
Regression to the mean
Diabetes vendors often split the population into high and low utilizers and claim credit for reductions in high utilizers (whom they manage) while counting the utilization increase in low utilizers toward their “savings” — as though last year’s high utilizers also would have increased had it not been for the program.
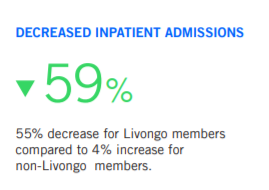 In this case, there are two giveaways that the 59% decrease in admissions is totally or mostly regression to the mean. The first giveaway is observing which diagnostic categories account for the bulk of an employer’s admissions. This is the top 10 list, in descending order. (“Del” means “delivery.”)
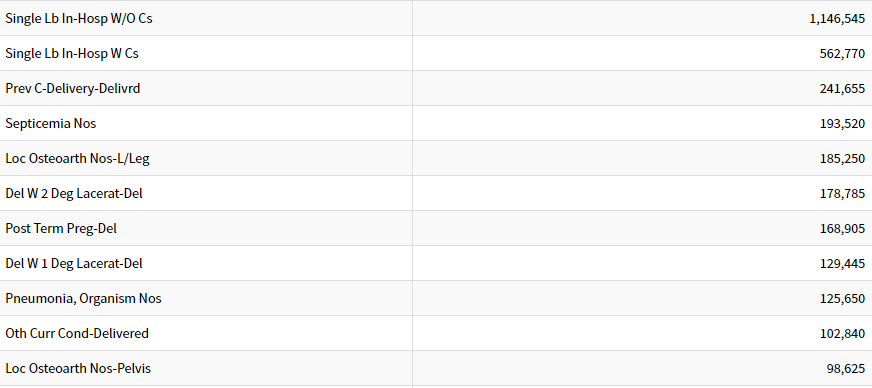 To begin with, the majority of admissions on this Top Ten list – and about a third of all employer-paid admissions — are birth events, not affected by a diabetes program.
You don’t see diabetes on this Top Ten list. That’s because diabetes itself in the last year for which complete data is available accounted for less than 1 admission per 1,000 commercially insured people (126,710 admissions in about 150 million privately insured people). Diabetes admissions don’t even crack the top 25. Because total employer-paid admission rates are about 50-60 per 1,000, eliminating every single diabetes event would decrease admissions by – get ready — about 2%.
See also: Putting Digital Health to Work
Reducing admissions by 59% would require wiping out not just every diabetes admission but also almost every admission not related to childbirth. The vendors might argue that temporary weight loss and eating better reduce other admissions, too. However, the only non-childbirth events in the top 10 are septicemia, joint replacements and pneumonia. Good luck crash-dieting your way out of those.
The other giveaway that this seemingly impressive “decrease” is regression to the mean is that the non-program-members (the vast majority of the population here) regressed upward to the mean. There is no reason to think that admissions in the average employee population are going to increase 4%. Over time, inpatient admissions in the commercially insured population are falling.
Using a selection methodology that is partly dependent on having high claims in the baseline assures both this apocryphal 55% “decrease”– and the equally apocryphal 4% increase in non-member admissions.
For instance, about a third of all heart attacks occur in people who did not have a pre-existing CAD diagnosis. Therefore, if you “manage” patients with diagnosed CAD, you will show a one-third reduction in heart attacks in that population, simply because you didn’t tally the heart attacks in the cohort you didn’t manage.
Then you’ll separately tally the employees without a pre-existing document CAD diagnosis, note the increase and say: “See how fast heart attacks increased in the population we didn’t manage.”
The right answer, of course, is to add the heart attacks in both cohorts back together. Naturally, you’ll find no reduction at all.
Coming soon: What is the Solution?
The next installment will cover how you should measure outcomes to avoid being taken advantage of and to see what really does happen in your population when you implement a diabetes prevention program.
To begin with, the majority of admissions on this Top Ten list – and about a third of all employer-paid admissions — are birth events, not affected by a diabetes program.
You don’t see diabetes on this Top Ten list. That’s because diabetes itself in the last year for which complete data is available accounted for less than 1 admission per 1,000 commercially insured people (126,710 admissions in about 150 million privately insured people). Diabetes admissions don’t even crack the top 25. Because total employer-paid admission rates are about 50-60 per 1,000, eliminating every single diabetes event would decrease admissions by – get ready — about 2%.
See also: Putting Digital Health to Work
Reducing admissions by 59% would require wiping out not just every diabetes admission but also almost every admission not related to childbirth. The vendors might argue that temporary weight loss and eating better reduce other admissions, too. However, the only non-childbirth events in the top 10 are septicemia, joint replacements and pneumonia. Good luck crash-dieting your way out of those.
The other giveaway that this seemingly impressive “decrease” is regression to the mean is that the non-program-members (the vast majority of the population here) regressed upward to the mean. There is no reason to think that admissions in the average employee population are going to increase 4%. Over time, inpatient admissions in the commercially insured population are falling.
Using a selection methodology that is partly dependent on having high claims in the baseline assures both this apocryphal 55% “decrease”– and the equally apocryphal 4% increase in non-member admissions.
For instance, about a third of all heart attacks occur in people who did not have a pre-existing CAD diagnosis. Therefore, if you “manage” patients with diagnosed CAD, you will show a one-third reduction in heart attacks in that population, simply because you didn’t tally the heart attacks in the cohort you didn’t manage.
Then you’ll separately tally the employees without a pre-existing document CAD diagnosis, note the increase and say: “See how fast heart attacks increased in the population we didn’t manage.”
The right answer, of course, is to add the heart attacks in both cohorts back together. Naturally, you’ll find no reduction at all.
Coming soon: What is the Solution?
The next installment will cover how you should measure outcomes to avoid being taken advantage of and to see what really does happen in your population when you implement a diabetes prevention program.
Looking harder at the language, note that the phrase is “recoup their investment,” not “were validated by the Validation Institute as having recouped their investment.” Yet the verb “saved” is in the past tense.
And the heading says: “How quickly employers recoup,” whereas the only article cited in the footnote analyzed Medicare patients, whose chronic disease are far more advanced.
Further, digging into the actual article (financed by the vendor) yields the following sentence [emphasis mine]:
We used a Markov-based microsimulation model in which a person’s characteristics are used to predict health outcomes in the upcoming year.
Elsewhere the article says:
We applied 26-week weight loss results to simulate potential health and economic outcomes
Therefore, this entire claim is based on a predictive simulation model that somehow morphs into a clear statement showing precisely $1,338 “saved."
Speeding up time
As can be seen from that graphic, this particular vendor is claiming a huge ROI in two years for employees with pre-diabetes. However, the Centers for Disease Control and Prevention says:
One in 3 adults in the United States has pre-diabetes (fasting blood glucose, 100–125 mg/dL); 15% to 30% of those adults will develop type 2 diabetes mellitus within 5 years.
See also: Diabetes: Defining Moment of a Crisis
So only a small minority of pre-diabetics will develop diabetes in five years. And then, of course, it would take years for avoidable complications to develop even if no one “manages” the newly diabetic employees to avoid them.
How, then can $1,338 of expenses per participant be claimed to be avoided by keeping these employees from getting sick in a measly two years when most of these employees aren’t going to be sick five years from now even without an intervention?
Comparing participants to non-participants
Speaking of “participants”…
Let’s be very clear: Whenever you see the word “participants” in a study report, the claimed outcome is vastly overstated. Participants will always outperform non-participants, regardless of the intervention. The National Bureau of Economic Research proved this using a randomized control trial. Further, on three other occasions, biased researchers trying hard to prove the opposite accidentally showed that 100% of their apparent “savings” were attributable to participation bias, meaning 0% to the program. (The bias won’t always account for 100% of the claimed savings, of course.)
The best example of this bias? A Koop Award-winning wellness program accidentally revealed that participants hugely outperformed non-participants even when there was not a program to participate in. In this slide, note the X-axis. The groups were separated in 2004. The program was implemented in 2006. During the two years between separation and implementation, the participants “saved” almost 20% vs. the non-participants by doing nothing.
This isn’t a secret. Participation bias is well-known to insiders in the diabetes industry. Yet every single diabetes vendor ignores this bias (or “matches” participants to some medical charts), while most also fail to disclose the dropout rate – and the fact that most employees who drop out of programs do so because they aren’t getting results.
Projecting participants’(!) short-term weight loss into the future
Essentially all of them do this, too. Very large-scale studies have shown that only the smallest percentage of people who lose weight keep it off. There is no reason to think that somehow a few diabetes vendors have unlocked the key to long-term weight loss that has eluded the rest of the world and all academic researchers, especially when the vendors don’t follow employees for the long term or count dropouts.
Rhetorical and arithmetical sleight-of-hand
This single set of claims from a diabetes vendor looks quite impressive at first glance:
Now look at it again, paying special attention to the underlined words:
Once again, there is that word “participants.” That is just the tip of the invalidity iceberg. Six variables were tracked…and yet 27% of active, motivated participants weren’t able to reduce any. Randomly, three should decline. And many of the other 73% of participants could reduce only one…and this is considered successful?
Further, these statistics look like averages on first glance –but they are not. They are examples (“improvements such as”) of reductions that maybe a few participants achieved. I can guarantee that, absent statins, virtually nobody reduces triglycerides by 29%.
Regression to the mean
Diabetes vendors often split the population into high and low utilizers and claim credit for reductions in high utilizers (whom they manage) while counting the utilization increase in low utilizers toward their “savings” — as though last year’s high utilizers also would have increased had it not been for the program.
In this case, there are two giveaways that the 59% decrease in admissions is totally or mostly regression to the mean. The first giveaway is observing which diagnostic categories account for the bulk of an employer’s admissions. This is the top 10 list, in descending order. (“Del” means “delivery.”)
To begin with, the majority of admissions on this Top Ten list – and about a third of all employer-paid admissions — are birth events, not affected by a diabetes program.
You don’t see diabetes on this Top Ten list. That’s because diabetes itself in the last year for which complete data is available accounted for less than 1 admission per 1,000 commercially insured people (126,710 admissions in about 150 million privately insured people). Diabetes admissions don’t even crack the top 25. Because total employer-paid admission rates are about 50-60 per 1,000, eliminating every single diabetes event would decrease admissions by – get ready — about 2%.
See also: Putting Digital Health to Work
Reducing admissions by 59% would require wiping out not just every diabetes admission but also almost every admission not related to childbirth. The vendors might argue that temporary weight loss and eating better reduce other admissions, too. However, the only non-childbirth events in the top 10 are septicemia, joint replacements and pneumonia. Good luck crash-dieting your way out of those.
The other giveaway that this seemingly impressive “decrease” is regression to the mean is that the non-program-members (the vast majority of the population here) regressed upward to the mean. There is no reason to think that admissions in the average employee population are going to increase 4%. Over time, inpatient admissions in the commercially insured population are falling.
Using a selection methodology that is partly dependent on having high claims in the baseline assures both this apocryphal 55% “decrease”– and the equally apocryphal 4% increase in non-member admissions.
For instance, about a third of all heart attacks occur in people who did not have a pre-existing CAD diagnosis. Therefore, if you “manage” patients with diagnosed CAD, you will show a one-third reduction in heart attacks in that population, simply because you didn’t tally the heart attacks in the cohort you didn’t manage.
Then you’ll separately tally the employees without a pre-existing document CAD diagnosis, note the increase and say: “See how fast heart attacks increased in the population we didn’t manage.”
The right answer, of course, is to add the heart attacks in both cohorts back together. Naturally, you’ll find no reduction at all.
Coming soon: What is the Solution?
The next installment will cover how you should measure outcomes to avoid being taken advantage of and to see what really does happen in your population when you implement a diabetes prevention program.