The ecosystem of hazard models and data is rapidly expanding, and this is exciting news for the P&C industry. But with all the hazard data that is being generated, especially during catastrophic events like hurricane and wildfire, comes the need for a more streamlined way to access it.
Data quality and modeling is continually improving—more accuracy, better science, higher resolution—which we have witnessed here at SpatialKey working with providers like KatRisk, JBA, RedZone, Swiss Re, Impact Forecasting, HazardHub and a host of others for a number of years now.
But while the quality and quantity of data in the market is abundant, some carriers are lagging behind when it comes to accessing and interpreting these models because their systems are disjointed and outdated. Accessing data from disparate sources, or “system hopping,” delays response time and can sabotage a carrier’s downstream customer satisfaction.
Three key challenges that insurance organizations face related to the accessibility of hazard data are:
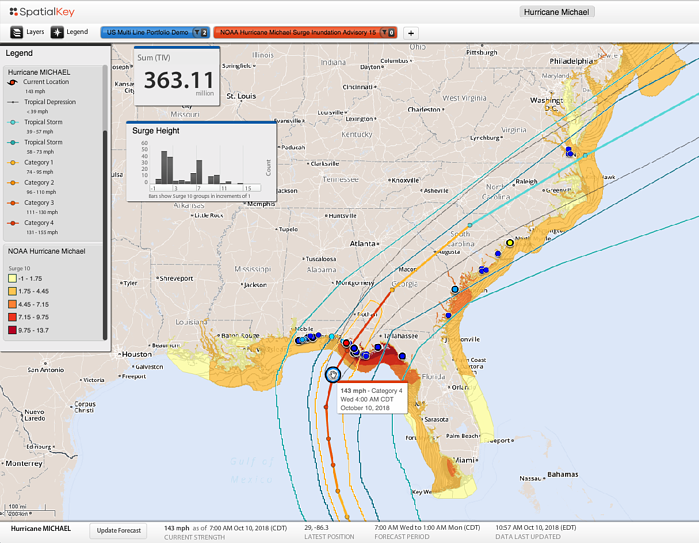 This pre-landfall view of Hurricane Michael from within SpatialKey is showing NOAA surge and wind bands overlaid with sample portfolio data. NOAA updates are available approximately every four hours during hurricanes, along with regular updates from expert providers like KatRisk, JBA, Impact Forecasting and others. This enables you to view and compare multiple models from within SpatialKey for a more comprehensive understanding of an event.
Solution: A platform like SpatialKey helps you assess if a model is the right fit for your business—enabling you to step through methodology and figure out the questions that models provoke but don’t answer. Hurricanes and wildfires, in particular, expedite the need to evaluate footprints to understand the business impact, as deriving insights is extremely time-sensitive. For example, you may be interested in the geographic boundary of a major flood to get boots on the ground. Or, you may want to understand the gauge readings (rain, river, surge measurements, etc.) in an effort to process and validate claims.
It’s time to streamline your access to expert data
Event response is a time-consuming effort, and it’s when speed and efficiency are needed most. In the early days of an event, you need to know how you and your customers will be affected and to what extent. But, you may feel like you have no time to get answers to stakeholders—and having to hop between disparate sources only delays your understanding. You need to streamline your access to expert data while providing a centralized location to compare views of risk and visualize data in the context of your portfolio.
See also: Turning Data Into Action
Now, with just one place to access and analyze data during time-sensitive events, you have...
This pre-landfall view of Hurricane Michael from within SpatialKey is showing NOAA surge and wind bands overlaid with sample portfolio data. NOAA updates are available approximately every four hours during hurricanes, along with regular updates from expert providers like KatRisk, JBA, Impact Forecasting and others. This enables you to view and compare multiple models from within SpatialKey for a more comprehensive understanding of an event.
Solution: A platform like SpatialKey helps you assess if a model is the right fit for your business—enabling you to step through methodology and figure out the questions that models provoke but don’t answer. Hurricanes and wildfires, in particular, expedite the need to evaluate footprints to understand the business impact, as deriving insights is extremely time-sensitive. For example, you may be interested in the geographic boundary of a major flood to get boots on the ground. Or, you may want to understand the gauge readings (rain, river, surge measurements, etc.) in an effort to process and validate claims.
It’s time to streamline your access to expert data
Event response is a time-consuming effort, and it’s when speed and efficiency are needed most. In the early days of an event, you need to know how you and your customers will be affected and to what extent. But, you may feel like you have no time to get answers to stakeholders—and having to hop between disparate sources only delays your understanding. You need to streamline your access to expert data while providing a centralized location to compare views of risk and visualize data in the context of your portfolio.
See also: Turning Data Into Action
Now, with just one place to access and analyze data during time-sensitive events, you have...
- Disparate solutions and proprietary formats
- Access to hazard data during time-sensitive events
- Ability to compare multiple views of risk
This pre-landfall view of Hurricane Michael from within SpatialKey is showing NOAA surge and wind bands overlaid with sample portfolio data. NOAA updates are available approximately every four hours during hurricanes, along with regular updates from expert providers like KatRisk, JBA, Impact Forecasting and others. This enables you to view and compare multiple models from within SpatialKey for a more comprehensive understanding of an event.
Solution: A platform like SpatialKey helps you assess if a model is the right fit for your business—enabling you to step through methodology and figure out the questions that models provoke but don’t answer. Hurricanes and wildfires, in particular, expedite the need to evaluate footprints to understand the business impact, as deriving insights is extremely time-sensitive. For example, you may be interested in the geographic boundary of a major flood to get boots on the ground. Or, you may want to understand the gauge readings (rain, river, surge measurements, etc.) in an effort to process and validate claims.
It’s time to streamline your access to expert data
Event response is a time-consuming effort, and it’s when speed and efficiency are needed most. In the early days of an event, you need to know how you and your customers will be affected and to what extent. But, you may feel like you have no time to get answers to stakeholders—and having to hop between disparate sources only delays your understanding. You need to streamline your access to expert data while providing a centralized location to compare views of risk and visualize data in the context of your portfolio.
See also: Turning Data Into Action
Now, with just one place to access and analyze data during time-sensitive events, you have...
- Increased your operational efficiency by reducing (or eliminating) disparate solutions.
- Streamlined your access to the most up-to-date footprints and models.
- Increased your understanding of risk with the ability to compare multiple hazards and models via a single solution.
- Gained an immediate understanding of your actual financial impact (so your stakeholders are happy).
- Focused your resources on what matters most: mitigation and customer outreach.